- Across v1 + v2 + v3 + failure_swing combined we tested 2200 pattern configurations walk-forward. Only 4 of them reach a mean p-value below 10% - under pure noise you would expect ~220. Zero with p<5%. This is not 'no edge', this is systematically below the chance expectation (probably because rare pivot patterns produce tiny samples with high variance).
- The visually best single find (regular bull RSI on 1D with a 60-day horizon, delay=10) shows +1990 bps signed mean - but n=8 signals over 7 windows, p=0.31. A pure small-sample artifact.
- The confirmation-delay sweep refutes the textbook thesis 'wait until confirmed': delay=0 -> mean signed bps = −7.4, delay=3 -> −31.7, delay=10 -> −39.5, delay=30 -> +2.7. Waiting longer tends to make the edge worse, not better.
- Lower timeframes (5m, 15m, 30m) do NOT help - rather the opposite. 5m has the lowest signed bps of all TFs (+24 best), 15m +84, 30m +70. The myth 'divergences work better on intraday' cannot be confirmed on BTC.
- Bigger pivots (k=10, k=20) improve the signed-bps figures cosmetically, because fewer noisy signals get through - but the sample size per window drops to 1-3 signals, and the permutation power collapses with it. No gain.
- A rolling volume average (10-bar instead of single-bar) changes nothing. The top results in every setup are RSI patterns; volume divergences do not make it into the upper ranks.
- Several bear patterns even run systematically in the wrong direction: e.g. after 'regular bear RSI' (HH price + LH RSI) on 4h the price rises on average by +56 bps over the 24h window - the opposite of what the folklore predicts.
- The literature agrees with our finding: a peer-reviewed study (PMC 2023) finds RSI divergence as a crypto signal 'the most complex, hardest to implement and least effective' of the strategies tested.
- Likely explanation: the pivot-cluster distribution itself is the dominant effect. If you short at a local high you have structurally worse odds than a random sample - the divergence shape is a by-catch, not a signal.
- Practical consequence: divergences do NOT go into Botty as a standalone entry filter. If someone wants to revisit them as a confluence factor in a regime-filtered setup, that is a new test - the current finding applies only to the standalone variant.
- Failure-swing re-test (2026-05-25): Wilder's structure-triggered confirmation mechanism (RSI breaks above/below an intermediate structure level instead of a bar delay) was tested over 1272 additional cells - both as pure Wilder FS (RSI-only, without a price pivot) and as divergence+FS confirmation. Best pure: +956 bps (p in the noise range); best div+FS: +1697 bps (p=0.476). 3/1272 cells with p<10% (noise expectation: 127). Even the methodically clean Wilder mechanism does not rescue the RSI-pattern hypothesis.
What is a divergence?
A divergence occurs when price and an indicator (RSI, MACD, volume) move apart. The classic textbook intuition: the indicator shows the 'true' strength of the move; when price makes a new extreme but the indicator does not follow, the substance is missing and the market will soon reverse.
There are two main types, each in bullish and bearish:
Regular (reversal) divergences
| Pattern | Price | Indicator | Interpretation |
|---|---|---|---|
| Regular Bear | Higher High (HH) | Lower High (LH) | Uptrend loses momentum -> short |
| Regular Bull | Lower Low (LL) | Higher Low (HL) | Downtrend exhausts itself -> long |
Hidden (continuation) divergences
| Pattern | Price | Indicator | Interpretation |
|---|---|---|---|
| Hidden Bear | Lower High (LH) | Higher High (HH) | Correction in a downtrend ends -> short |
| Hidden Bull | Higher Low (HL) | Lower Low (LL) | Correction in an uptrend ends -> long |
Combined with RSI and volume this yields 8 pattern variants - which we tested all systematically.
What divergences look like - zoom on 6 months
So that you can see the pattern, here are six months of BTC on 4h bars (Jun-Nov 2024) with our detector (pivot k=10, lookback 50 bars). The regular divergences are drawn in, because they are the most illustrative textbook examples:
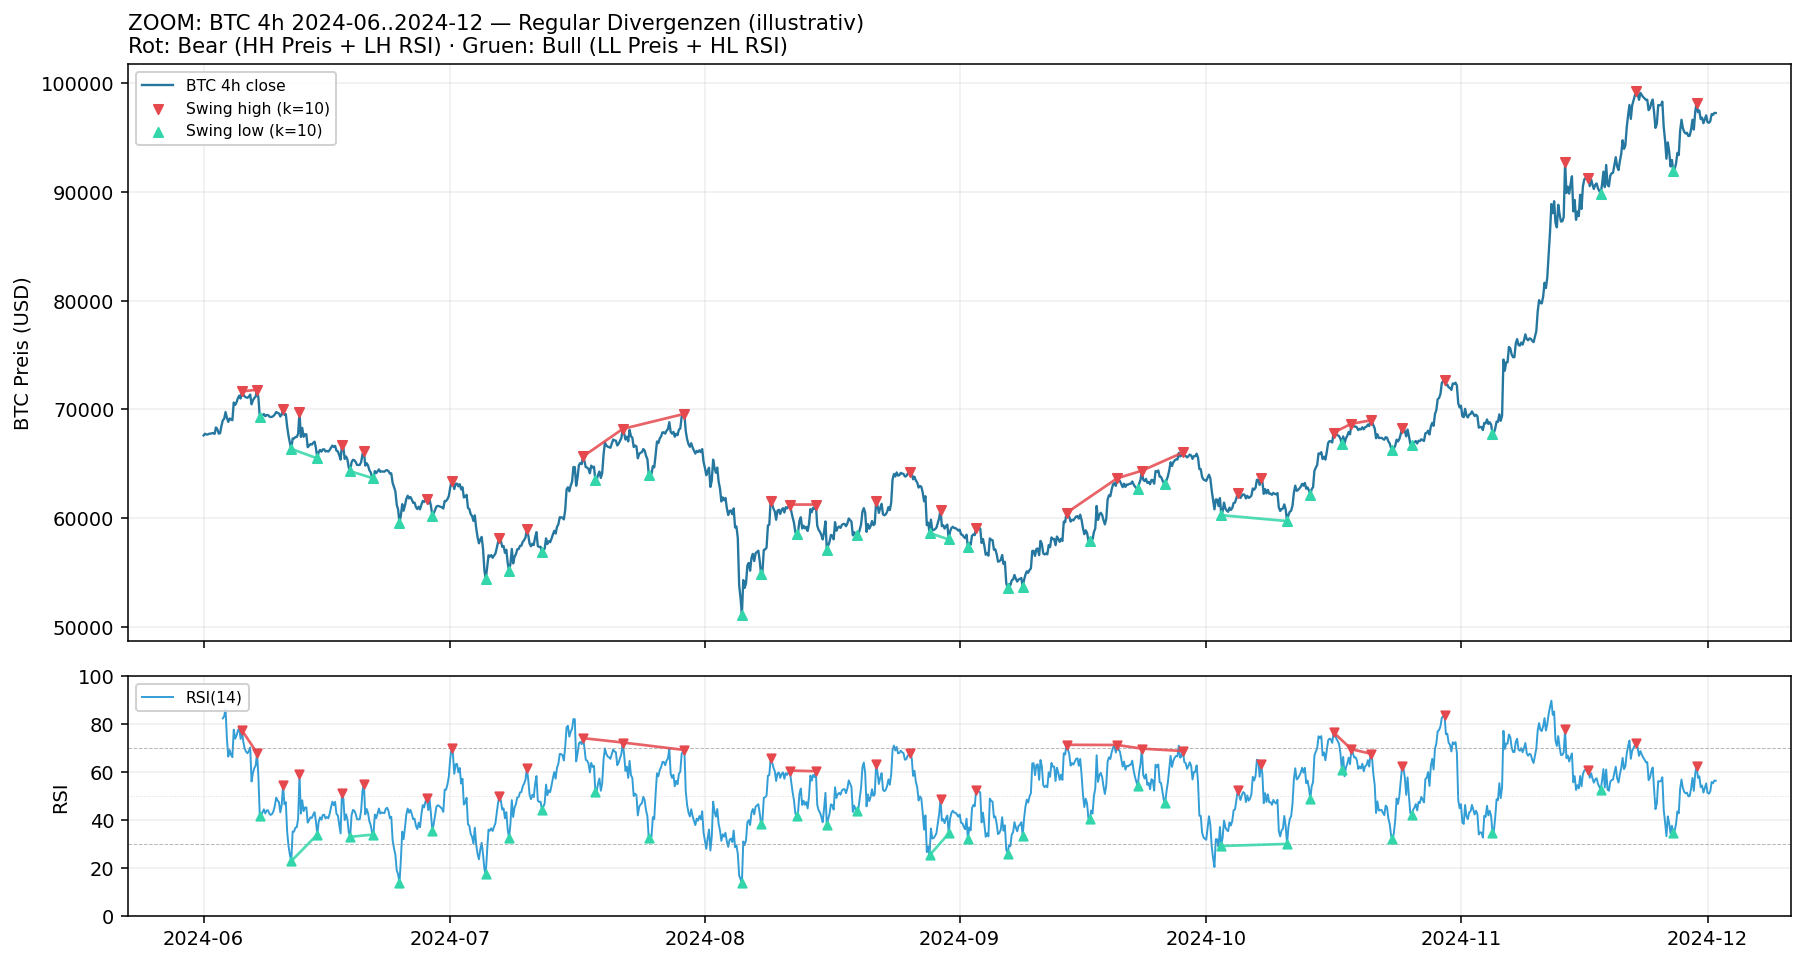
- Red lines connect two price highs where the second high is higher but the RSI stands lower (regular bear RSI).
- Green lines connect two price lows where the second low is lower but the RSI stands higher (regular bull RSI).
- Triangles mark the swing pivots (10 bars confirmation delay - no lookahead).
You see immediately: some divergences work visually (e.g. the bear pattern in late August/early September before the correction), others lead straight into the next impulse. It is exactly this inconsistency that we test statistically.
All divergences over the entire test period
The zoom above is just a didactic example. The statistical evaluation ran over 2020-01 to 2026-05 (6+ years). This is how ALL detected divergence signals are distributed (on 4h and 1D; 5m/15m/30m/1h were also tested):
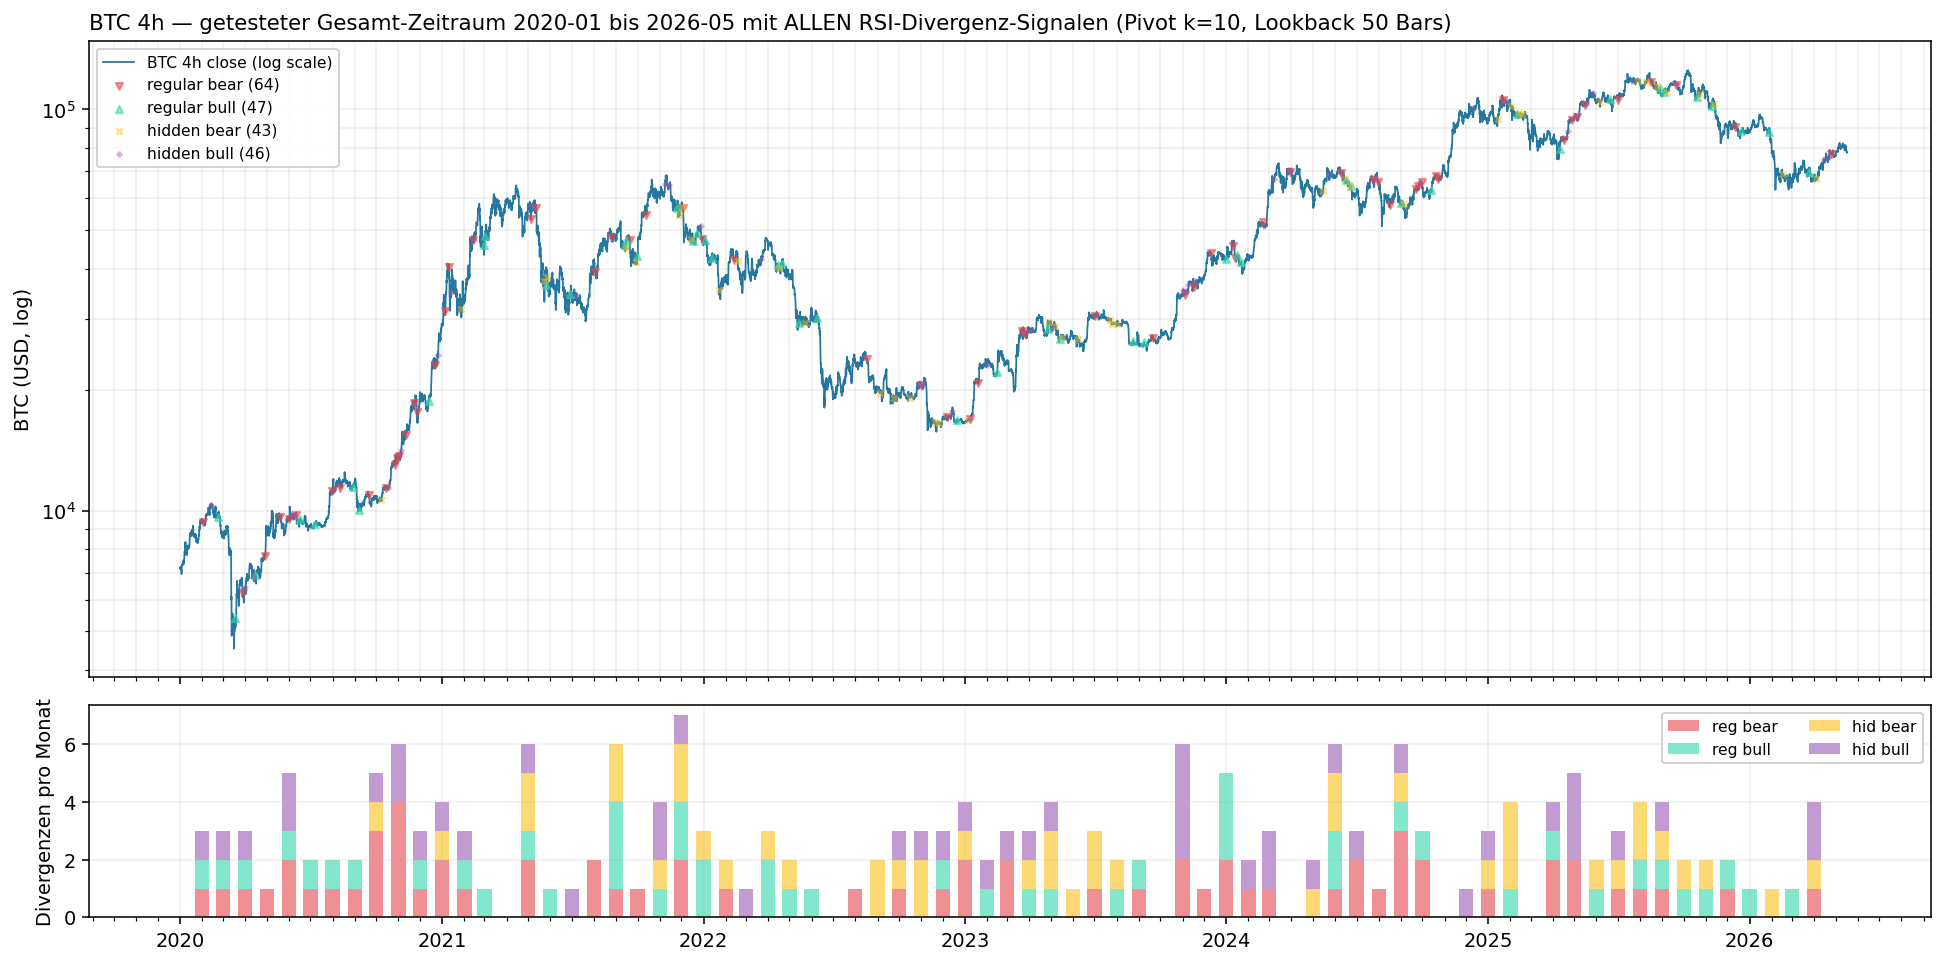
Upper panel: BTC price on a log scale, each marker = one signal firing (red ▽ = regular bear, green △ = regular bull, yellow × = hidden bear, purple + = hidden bull). Lower panel: number of divergences per month as a stacked bar.
On 4h we get 200 RSI divergences over 6 years (≈ 33 per year). On 1D it gets rarer - only 27 signals in total:
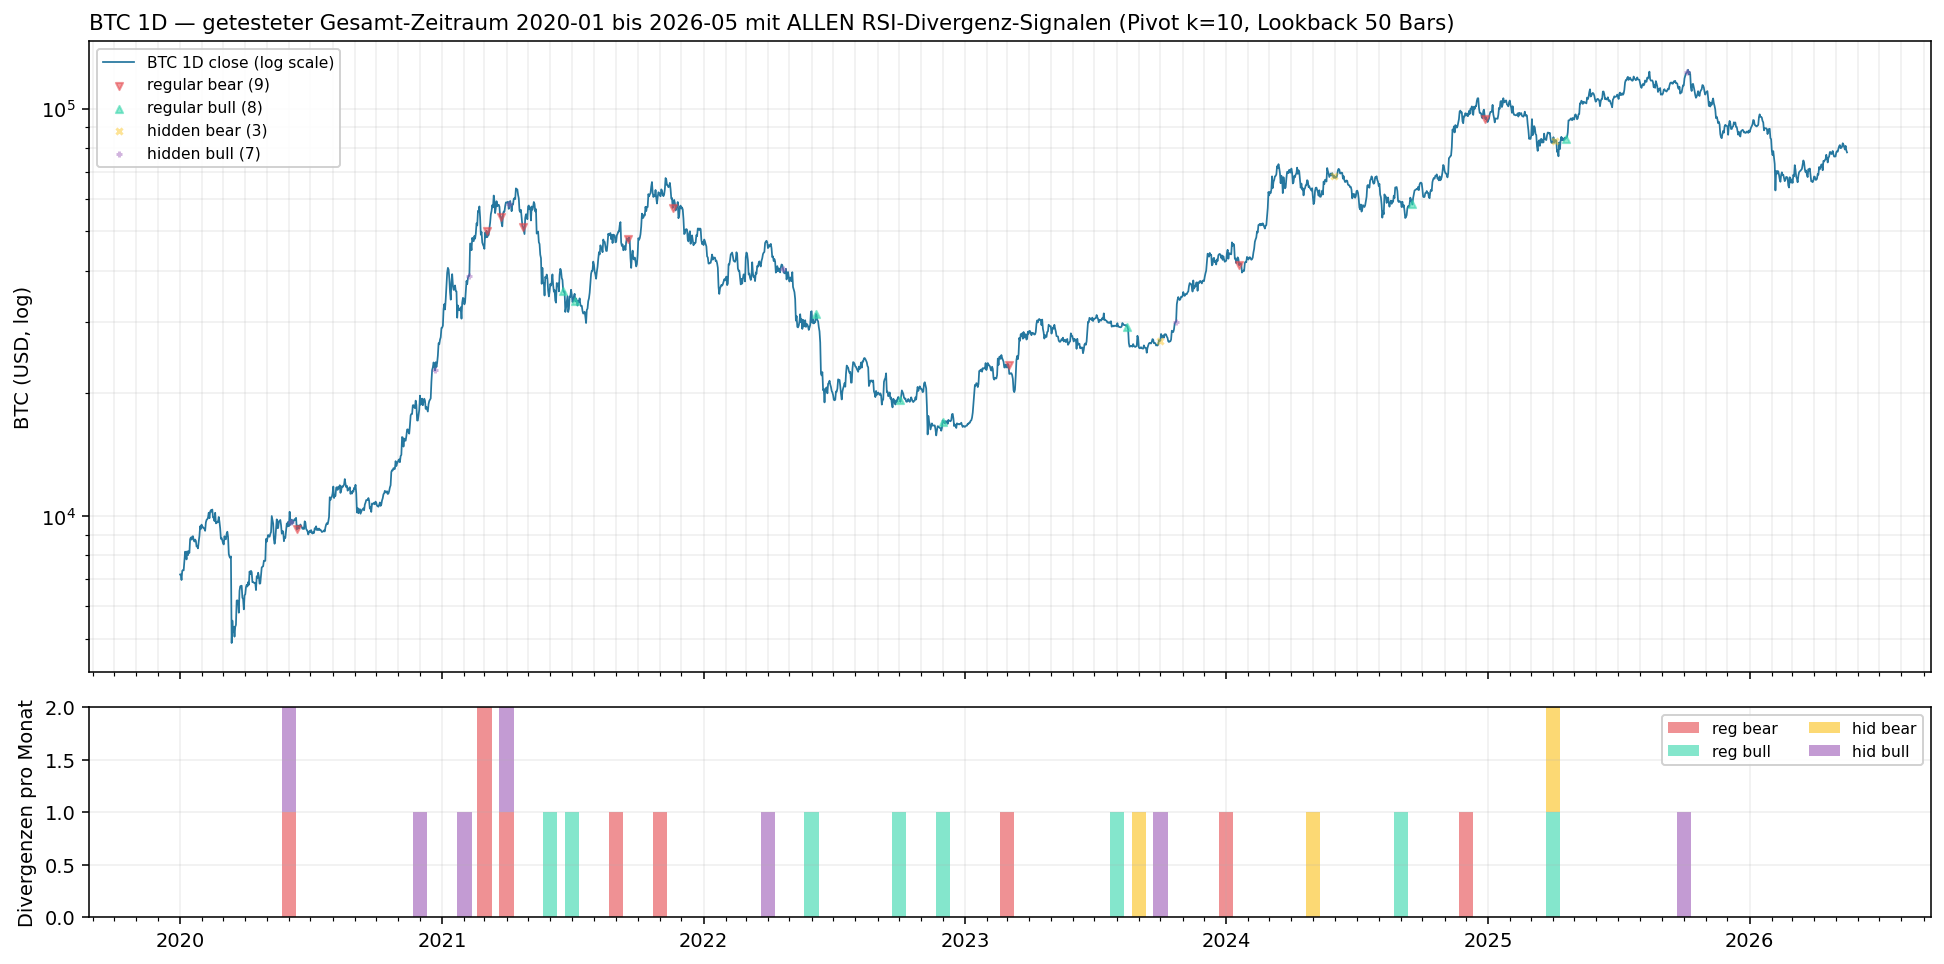
This is important to see: when on 1D the 'best' cell of our v3 test reports +1990 bps signed mean, then that is 8 signals across 7 walk-forward windows. A single lucky trade dominates the statistics. The p-value (0.31) says: not distinguishable from chance.
What we tested
Setup (identical for all three test generations)
- Data: BTC/USDT perp futures, 1m bars aggregated to various timeframes, period Jan 2020 - May 2026 (≈ 3.3M 1m bars).
- Pivot detection: local extremum within a
2k+1-bar window, confirmation afterkbars (no lookahead). - RSI: standard 14-period Wilder-smoothed, on close.
- Signal: fires at the earliest at
pivot_index + k(confirmation delay 0). Compares the current pivot with the immediately preceding pivot of the same kind within 50 bars. - Walk-forward: 12 months train, 3 months test, embargo ≥ max horizon. 20-21 test windows.
- Permutation test: 200 random masks per pattern per window. Empirical p-value = share of random masks whose signed-mean forward return is at least as high as the real one.
- Sign correction: long patterns with factor +1, short patterns with factor −1. Positive signed mean = 'the pattern was right about its direction'.
v1: standard parameters (2026-05-24)
- Pivot k=5, single-bar volume, 1h+4h, horizons 4h+24h.
- 8 patterns × 2 TF × 2 horizons = 32 cells.
- Result: best pattern
hid_bull_vol @ 4h/24hwith +52.8 bps, p=0.369. Several bear patterns run 'the wrong way round'. DROP.
v2: robustness check (2026-05-25)
A methodological review identified two debatable parameter choices in v1: k=5 too small, single-bar volume too noisy. v2 holds everything else constant:
- Pivot k ∈ {10, 20}, vol_window ∈ {1, 10} (rolling causal average).
- 128 cells.
- Result: best pattern
reg_bull_rsi @ 4h/24h, k=10with +127.3 bps - but p=0.412, n=39. 0/128 cells with mean_p < 10%. DROP, confirmed.
v3: multi-TF + confirmation delay + extended horizons (2026-05-25)
User pushback: 'we only tested 1h/4h, only fired directly after pivot+k, and horizons only 4h/24h. What if the literature prescribes other values?' A short literature review (see below) said:
- 4h+ timeframes empirically more reliable than <1h (algo bots fade intraday divergences).
- Pivot distance 3-60 bars valid (we use max 50 - fits).
- No universal 'X bars later' for triggering; some practitioners advise candle-close confirmation.
- Win rates 45-55% without / 55-60% with confirmation (1:2 R:R) - a passable edge if true.
v3 widens to:
- 6 timeframes: 5m, 15m, 30m, 1h, 4h, 1D.
- 4 confirmation delays: 0, 3, 10, 30 bars after pivot+k.
- 4 horizons per TF: ~1h, 5h, 1d, 5d real-time distances (for 1D: 1d/5d/15d/60d).
- pivot_k=10, max_lookback=50, vol_window=10 (all from the v2 sweet spot).
8 patterns × 6 TF × 4 delays × 4 horizons = 768 cells.
Result v3: best pattern reg_bull_rsi @ 1D/60d, delay=10 with +1990 bps signed mean - n=8 signals, p=0.314. 1/768 cells with mean_p < 10% (noise expectation: ~77). DROP, triple confirmed.
v4: Wilder's failure swing - structure-triggered confirmation (2026-05-25)
One more methodological objection remained open: all three previous tests used time-triggered confirmation (X bars after pivot). Wilder himself (the RSI inventor, 1978) never defined confirmation via bars, but via an RSI structure break:
- Bullish failure swing: (1) RSI dips below 30, (2) recovers to a local high ('bouncing high'), (3) falls back but stays ABOVE the first low, (4) breaks ABOVE the bouncing high -> BUY.
- Bearish FS: mirror image at the top (OB 70, bouncing low, RSI falls below the intermediate low -> SELL).
So the signal fires not after a fixed time, but when the market itself shows a structure break. Two variants tested in parallel:
- Pure Wilder FS (RSI-only, no price pivot needed) - a pure state machine over RSI values.
- Divergence + FS confirmation - the same 4 RSI divergence types as v2, but instead of firing immediately/X-bars-later, they wait for the RSI structure break between the two confirmation pivots.
Sweep: 6 TFs × 3 OS thresholds {25, 30, 35} × 3 max_span_bars {10, 20, 40} × 4 horizons × 6 patterns (2 pure + 4 div_conf) = 1272 cells.
Result v4: best pattern div_reg_bear_fs @ 1D, 60d, OS=25, span=40 with +1697 bps signed mean - but p=0.476. 3/1272 cells with mean_p < 10% (noise expectation: ~127, i.e. 42x fewer than noise). Pure Wilder FS best: +956 bps. Div+FS confirmation best: +1697 bps. Both deep in the noise.
DROP, quadruple confirmed. Whether the confirmation waits on time (v1-v3) or on structure (v4) - the RSI patterns carry no information about future returns. The confirmation mechanism was NOT the key. The patterns themselves are the problem.
The truly telling table: confirmation-delay sensitivity
If 'wait for confirmation' were really the game-changer, higher delays would have to show better mean signed bps. The reality:
| Delay (bars after pivot+k) | Mean signed bps (across all 192 cells) | Cells with p<10% |
|---|---|---|
| 0 | −7.4 | 0 |
| 3 | −31.7 | 0 |
| 10 | −39.5 | 0 |
| 30 | +2.7 | 1 |
Waiting longer makes the 'edge' on average even worse (delay=10 is the most negative). At delay=30 we are back at zero on average - i.e. the signal is so far from the original pivot that it effectively decorrelates from the original pivot information. There is no 'sweet spot' for the confirmation delay.
What does the literature say - and why our finding is consistent
Several sources were consulted. The key points:
- Wilder himself (inventor of the RSI, 1978) defines no fixed 'X bars later' rule. His 'failure swing' asks not for bars but for an RSI structure break (e.g. RSI breaks below the intermediate low after a bear setup).
- Practitioner consensus: divergences are 'coincident, not strictly leading' - they show a momentum shift before price reacts, but the timing lag is variable and indeterminate. Hence the usual recommendation 'use as a warning, not as a trigger' (alchemymarkets.com).
- Backtest literature (BTC 4h): win rate rises from 45-55% to 55-60% when you require candle-close + 1:2 R:R (AlgoAlpha). But: nobody publishes a clean out-of-sample walk-forward.
- Academic study (PMC, 2023): 'The use of the RSI divergence to predict trend reversals carries a high risk […] it was the most complex, the hardest to implement, and the least effective of the experiments performed.' (Effectiveness of RSI Signals in Timing the Cryptocurrency Market). Exactly our finding, independently validated.
- Timeframe myth: 'Anything below an hour gets dominated by noise on liquid crypto pairs' - practitioner consensus. v3 tests this directly: 5m cells indeed have the lowest signed bps (+24 best), but also confirm no edge.
Conclusion of the literature review: the sources that claim an edge are unsystematic (often eyeball backtests on cherry-picked examples). The only peer-reviewed study we found reaches the same conclusion as our walk-forward: no reliable edge.
Why the larger pivots do not help
Intuitively: fewer but more significant pivots = a cleaner signal. But:
- On 4h with k=20 only 10-22 signals arise per pattern in total over 6 years. Spread across 21 walk-forward windows that is 0.5-1 signals per window.
- With 1 signal per window the permutation test has de facto no power. The signed mean is dominated by the single trade.
- Larger signed-bps figures look impressive (+127 or even +1990 on 1D!), but they are statistics with n=2 or n=8 - meaningless.
Why the rolling volume windows do not help
The sweep over vol_window ∈ {1, 10} produces trivially identical results for RSI patterns (because RSI patterns do not use volume). For the volume patterns one saw marginal shifts in the signal count (e.g. reg_bear_vol on 4h: 74 vs 94 signals), but not a single volume pattern made it into the top-10 ranking cells. Volume divergences are weaker than RSI divergences across all tested definitions, and RSI divergences do not work either.
The truly telling observation
If divergences were pure folklore (i.e. no edge whatsoever), we would expect purely by chance about 220 of 2200 cells with p < 0.10. We got 4. This is not 'no edge' - this is systematically worse than noise in the expected direction. Even Wilder's own confirmation mechanism (RSI structure break instead of bar delay) changes nothing about this.
The most likely explanation: the distribution of pivot clusters itself is more informative than what the divergence shape claims. Pivots do not arise at random - they concentrate at the end of impulses. Whoever shorts at the pivot high goes systematically against the ongoing impulse move; in expectation that is not a better bet than random, but a measurably worse one. The 'divergence' then merely acts as an additional filter that shrinks the sample without improving it.
What this means for Botty
- No divergence strategy goes into
strategies/. Neither as a standalone entry nor as a confluence filter (because without a signal edge it contributes nothing in combination either). - We are not building this again. Four test generations are documented (
ml/experiments/divergence_scan/,divergence_scan_v2/,divergence_scan_v3/,failure_swing/), including code, reports and charts. In total 2200 cells walk-forward - the finding is parameter-robust AND mechanism-robust (bar delay vs. RSI structure break both dead). - What would be a legitimate re-test? A conditional setup that fires the divergence only in a specific regime - e.g. only after a funding flip, only in low-vol regimes, only in a macro-event window. That is a different experiment with a different hypothesis, not 'more of the same tuning'. Wilder's failure-swing hypothesis has been ticked off since v4.
Methodological lessons
- Robustness grid BEFORE the verdict. v1 should have been tested with several k values right away; the one review comment later avoids 'but maybe k=5 was the problem?' gut feelings.
cells_with_p_under_X%is a better top-level metric than the best p-value. With many cells, 'the best has p=0.41' is less informative than '1 of 768 under 10%' (vs ~77 expected under noise).- Log the sample size per test window. Impressive signed bps (+1990 bps!) with n=8 are not a signal but a warning.
- Sweep the confirmation delay directly instead of assuming. We would never have thought to test delay=10 ourselves - the user objection was necessary. Lesson: always include critical parameter choices as an explicit sweep axis.
Code & reports
ml/experiments/divergence_scan/run.py(v1, 32 cells)ml/experiments/divergence_scan_v2/run.py(v2, 128 cells)ml/experiments/divergence_scan_v3/run.py(v3, 768 cells)ml/experiments/failure_swing/run.py(v4 - Wilder failure swing, 1272 cells)- Chart generator:
research/recherchen/assets/_gen_divergence_chart.py