- "Regime" means two different things that must never be conflated: STRUCTURAL (trend vs. range - what ADX/DMI does) and VOLATILITY (calm vs. turbulent - orthogonal to direction). Most ADX alternatives answer the same structural question; but the actual statistical edge in BTC data lies in the vol regime.
- Direct ADX/DMI alternatives for trend-vs-range: Hurst exponent (H>0.55 trending, already in data/indicator_cache.py::_compute_hurst), Lo-MacKinlay variance-ratio test (with a real p-value), Kaufman Efficiency Ratio (the basis of KAMA), Choppiness Index, regression R^2 (trend + direction in one) and return autocorrelation (positive=momentum, negative=mean-reversion). An ensemble by majority vote usually gives more robust blocks than any single indicator.
- Probabilistic regime models: HMM/Markov switching (latent states + transition probabilities), k-means/GMM clustering (unsupervised) and changepoint detection (BOCPD online, PELT/CUSUM offline). GARCH is the standard model specifically for vol clustering. All of them yield probabilities/states rather than a 0-100 scale like ADX.
- Botty has already tested HMM (ml/experiments/hmm_regime): a causal 2-state vol HMM, pooled IC +0.39 walk-forward, 100% window stability, verdict PURSUE - but partly redundant with the simple trailing rv_4h. Methodologically decisive: hmmlearn's predict_proba is SMOOTHED (uses the future) - the main source of inflated HMM results in crypto papers; Botty uses only the causal forward filter.
- Botty has promoted BOCPD (ml/experiments/bocpd, live in ml/forecast/bocpd_live.py): p_short = P(run_length<4) has IC +0.16 vs. forward-4h vol, positive in 21/21 windows; bars in a fresh changepoint regime show +27% higher forward vol. It predicts WHEN a structural break happens - not in which direction.
- The directional regime is NOT predictable in Botty's data: vol_regime_transitions is DEAD (strongest transition +6 bps, t +0.14 - "direction at the regime boundary is noise"), regime_clustering is INCONCLUSIVE (spread 32 bps, but t-stat -0.68 too weak). Predicting the directional regime is equivalent to predicting returns - and that is hard.
- Every detector lags - real-time regime detection is always a trade-off between responsiveness and stability. Botty's hysteresis (trend from ADX 25, out only below 20) is exactly this deliberate trade-off; it prevents whipsaw at the threshold at the cost of delayed turn detection.
- External context signals explain a regime rather than merely measuring it: funding-rate regime (long/short crowding), futures term structure (contango/backwardation), cross-asset (DXY, ETF flows - tested in dxy_shock/etf_flow_event), implied vol (Deribit DVOL as market expectation). They are causally leading where pure price indicators lag.
- USING it means filter, not switch: the regime-switch hybrid (SFP in trend / BB in range) was empirically refuted in the Indicator Lab - -392 bps per trade (t=-3.69), parameter plateau 0%. A switch only harvests both edges if both sub-strategies have INDIVIDUALLY validated, regime-anticorrelated edges; right now Botty has zero of those. So a switch combines two zeros and doubles the overfit surface.
- A regime filter does not create an edge - it only cuts samples away. It helps solely for entries whose edge is regime-conditional (exactly what Stage 1 in the Indicator Lab measures: the 'ceiling with a perfect regime filter'). A more robust gate on an edgeless entry is a more robust nothing.
- Newly built (2026-06-10): regime_ensemble_filter - a real 2-of-3 majority vote. ADX, Efficiency Ratio and Choppiness each cast a trend vote (ADX>=20 / ER>=0.30 / CHOP<=55 at the moderate operating point); from 2 votes on, the gate is open. This is the one gate form that stacked single filters cannot express: two stacked filters are always AND-linked (2-of-2) - the ensemble forgives one dissenting lens. On the last 540 BTC daily candles, 27% of days are such 2-of-3 cases.
- The question 'which gate is best?' is not decided in theory but in the mega-sweep bake-off (regime_gate_bakeoff_v1): 4 gate forms as the ONLY free variable on identical ema_crossover trades; the winner is whatever lifts the edge most stably across walk-forward + PBO - not what looks nicest in the training window. Ready to run; waiting for the running sweep to finish.
Starting point: what Botty does today
The live regime filter (indicators/regime.py) uses Wilder's ADX(14) for trend strength + DMI (+DI/-DI) for trend direction, with hysteresis (trend from ADX>=25, out only below 20), and colors the BTC candles in /regime into three blocks: trend_up, trend_down, range. This is a clean, causal, battle-tested approach - but only one lens. This research places it in the overall landscape and draws on Botty's own walk-forward experiments in ml/experiments/.
First: there are two different "regimes"
The most important conceptual separation - conflate them and you look for edge in the wrong place:
| Question | Tool | Botty status | |
|---|---|---|---|
| Structural | Does the price move directionally or oscillate? | ADX/DMI, Hurst, variance ratio ... | <- the /regime filter |
| Volatility | How violent are the moves (regardless of direction)? | rv terciles, GARCH, HMM, BOCPD | <- the actual statistical edge |
ADX/DMI only answers the first question. So do most of the alternatives below. But: across dozens of experiments Botty's ML module found that in BTC data the volatility regime is what carries walk-forward-stable signal - direction, by contrast, barely does.
A. Other trend-vs-range detectors (same question, different math)
Direct ADX alternatives. Each of them could be laid as a comparison track next to the ADX(7/21/28) panels that already exist in /regime.
| Method | Idea | Special feature |
|---|---|---|
| Hurst exponent / R/S analysis | H>0.55 = persistent/trending, H<0.45 = mean-reverting, H~0.5 = random walk | Already in the repo: data/indicator_cache.py::_compute_hurst. Comes from fractal geometry (Hurst 1951, Mandelbrot). |
| Variance-ratio test (Lo & MacKinlay 1988) | Does variance scale linearly with the horizon (random walk), faster (trend) or slower (mean-reversion)? | Delivers a real p-value, not just a threshold - more statistically grounded than ADX. |
| Efficiency Ratio (Kaufman) | Net move / sum of absolute moves over N bars, 0-1. High = efficient trend, low = chop | The basis of KAMA (adaptive MA). Very cheap to compute. |
| Choppiness Index (Dreiss) | ATR sum vs. total range, log-normalized to 0-100 | Built explicitly for "trend vs. chop"; often more intuitive to read than ADX. |
| Regression slope + R^2 | Linear regression over N bars: R^2 measures how clean a trend is, the slope gives the direction | Trend strength and direction in one measure - unlike ADX, which offloads direction to DMI. |
| Return autocorrelation | Lag-1 autocorrelation of returns: positive = momentum/trend, negative = mean-reversion | A direct measure of which strategy class currently fits. |
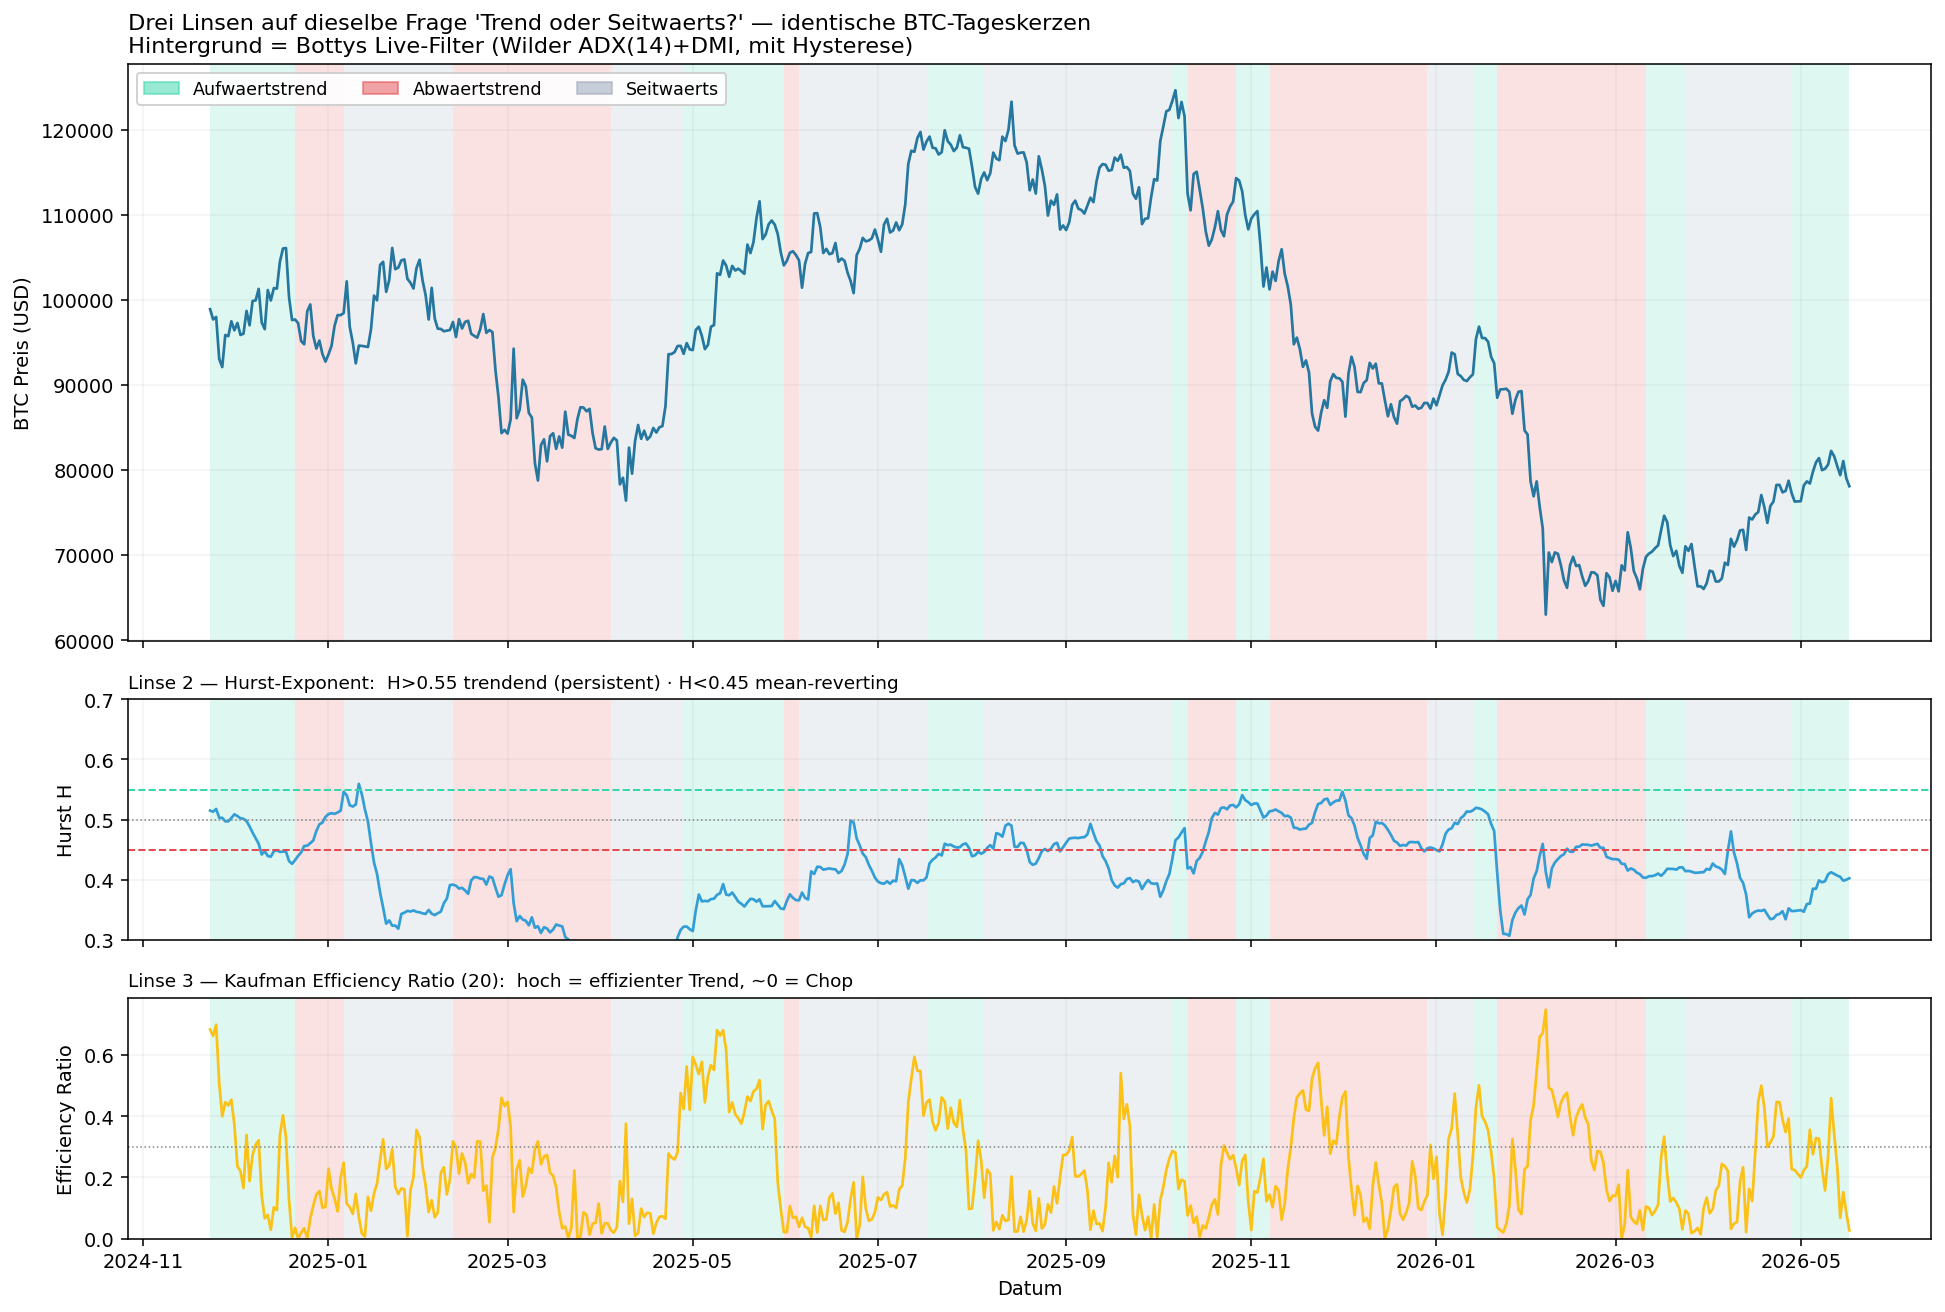
The added value of an ensemble: ADX + Hurst + Efficiency Ratio by majority vote usually produces more robust regime blocks than any single indicator - less flicker at the thresholds, because three independent maths have to agree.
The following chart overlays exactly that on real BTC daily candles: on top the price, colored by Botty's live filter (ADX/DMI), below it Hurst and Efficiency Ratio. You can see directly where the three lenses agree (clean trends -> high Efficiency Ratio, H>0.55) and where they do not (sideways phases, where Hurst oscillates around 0.5):
B. Volatility regime - where Botty's data sees the real edge
| Method | What it is | Botty status |
|---|---|---|
| Realized-vol terciles / rv_4h z-score | Rolling realized vol, cut into terciles/z-scores | Used throughout ml/; "vol-as-sizing is the only edge in this data" (quote from vol_regime_transitions). |
| GARCH family (Engle 1982, Bollerslev 1986) | Models vol clustering explicitly: tomorrow's vol depends on today's | A classic, not yet tested in Botty - an obvious gap. |
| Vol forecast (GBM/gradient boosting) | An ML model that forecasts the coming 4h vol directly | Live: ml/forecast/, 4h-IC +0.83 walk-forward. |
| Implied vol (Deribit DVOL) | Market expectation of vol derived from option prices | External, not yet tapped - would be a leading rather than lagging indicator. |
The punchline: BTC volatility is persistent (turbulent today -> probably turbulent tomorrow), so it is genuinely predictable. That is exactly what Botty's IC values confirm.
C. Probabilistic / model-based regimes - and what Botty found
These methods yield probabilities or latent states rather than a 0-100 scale.
| Method | What it is | Botty verdict (walk-forward) |
|---|---|---|
| HMM (Hidden Markov) | Latent states (calm/turbulent) with transition probabilities; Rabiner 1989 | hmm_regime: PURSUE - vol IC +0.39, 100% stability, but partly redundant with rv_4h |
| Markov switching (Hamilton 1989) | Regression with regime-dependent parameters (mean/vol per state) | not yet tested |
| BOCPD (Adams & MacKay 2007) | Online probability that a structural break is happening right now | bocpd: PROMOTED - p_short IC +0.16, 21/21 windows, +27% vol uplift. Live in ml/forecast/bocpd_live.py |
| PELT / CUSUM | Offline changepoint (segmentation of historical series); Killick et al. 2012 | not tested; good for backtests, not live |
| k-means / GMM clustering | Unsupervised regime finding in feature space | regime_clustering: INCONCLUSIVE for direction (spread 32 bps, t-stat -0.68) |
warning: the methodological trap Botty deliberately avoids
HMMs (hmmlearn.predict_proba) are smoothed by default - they use future observations for state estimation. This is the main source of inflated HMM results in published crypto papers (lookahead bias through the back door). Botty's hmm_regime experiment uses exclusively the causal forward filter (alpha-only), so that the state at time t depends only on data up to t - exactly as ADX has no lookahead. Anyone building regime models must strictly distinguish between filtering (causal) and smoothing (non-causal).
D. External context: explaining a regime rather than just measuring it
Pure price indicators (ADX, Hurst ...) lag. External signals can lead:
- Funding-rate regime - long/short crowding on perps (on Botty's Pifagor-gaps list)
- Futures term structure - contango/backwardation as a risk-on/off proxy
- Cross-asset - DXY shocks, BTC-equity correlation, ETF flows (tested in
dxy_shock,etf_flow_event) - Implied vol (DVOL) - market expectation instead of realized past
- On-chain - NVS/trap-line-like flows (Pifagor memory)
"Detecting" vs. "predicting" - the honest answer
This is the crux of the question, and Botty's own data answers it clearly:
- The vol regime is predictable. Persistent -> HMM/BOCPD/vol forecast deliver genuine out-of-sample signal (IC +0.39 / +0.16 / +0.83).
- Predicting the directional regime = predicting returns. Nearly impossible.
vol_regime_transitionsdied precisely on this: strongest transition +6 bps, t +0.14 - "direction at the regime boundary is noise". - Every detector lags. Real-time detection is always a trade-off between speed and stability. The hysteresis in the
/regimefilter is that trade-off, deliberately in favor of stable blocks.
This finding is directly visible in Botty's data. Top: realized vol comes in blocks (clustering = persistence) - calm stays calm, turbulent stays turbulent, which is why it is predictable. Bottom left: the forward-4h vol rises cleanly across the vol regimes (29% -> 41% -> 67% ann.). Bottom right: the forward-4h return per regime stays flat around a few basis points - i.e. noise:
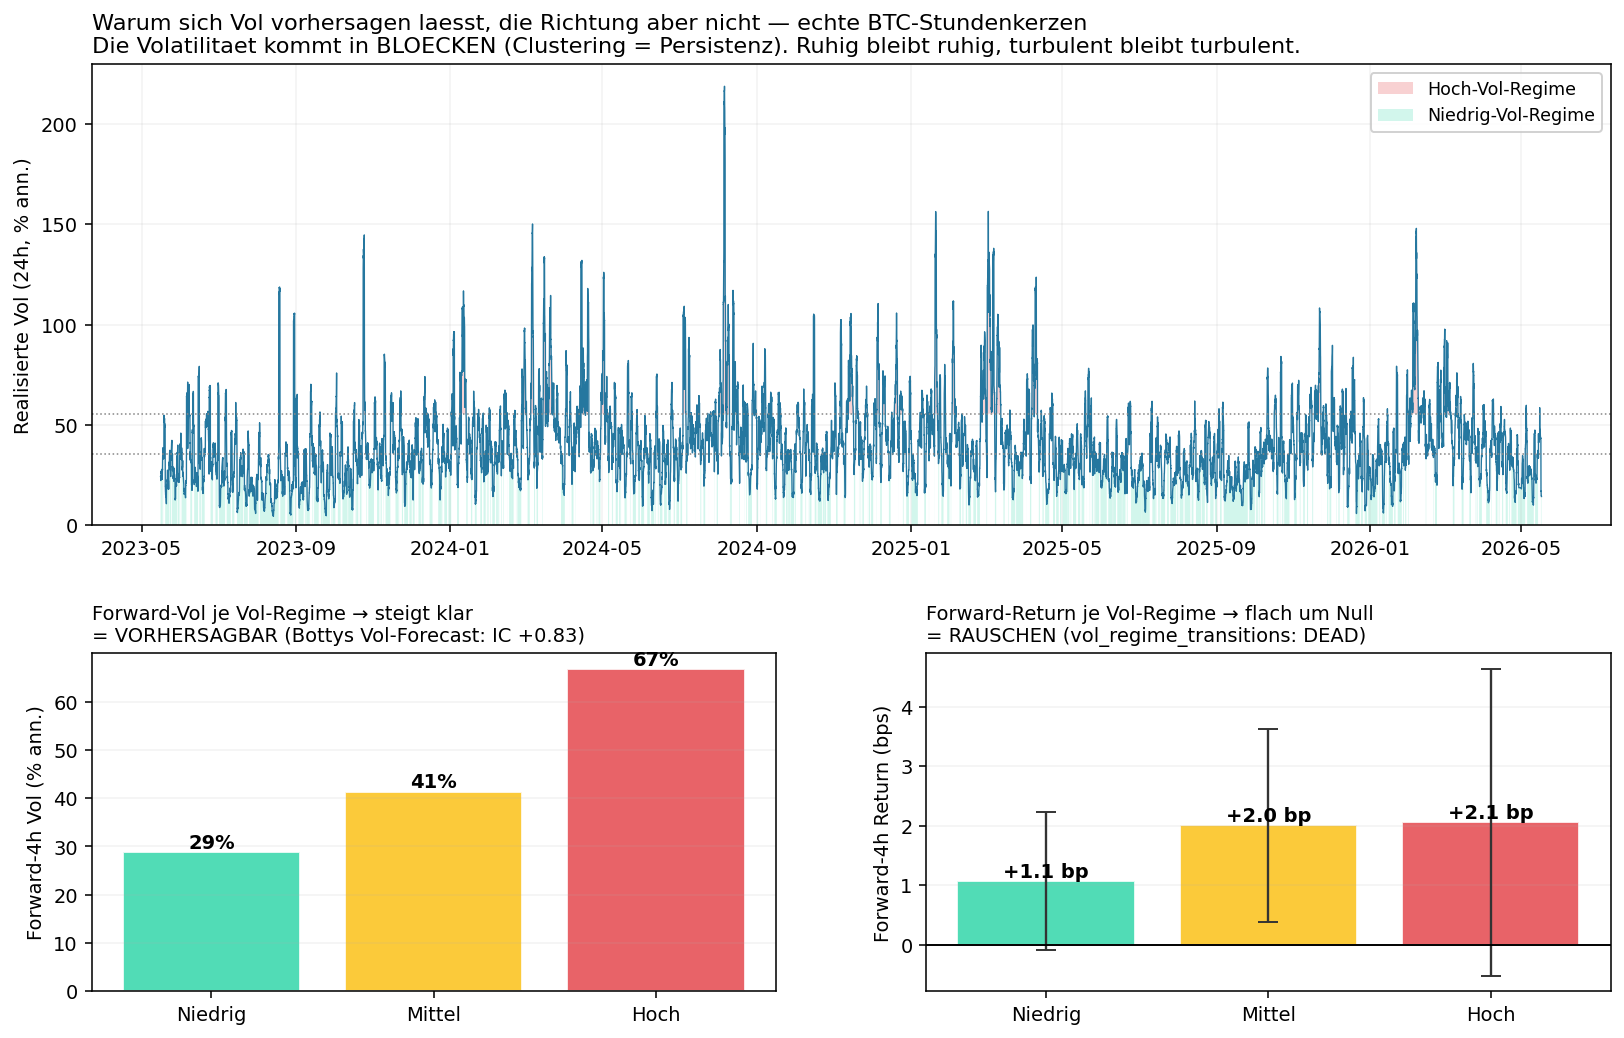
In short: what can realistically be "predicted" is the vol regime and the changepoint probability - not whether an up- or down-trend comes next.
What this means for Botty
Almost all of it already sits half-finished in the repo:
- Hurst is already computed (
data/indicator_cache.py::_compute_hurst) - can be made visible as a comparison panel in/regime(analogous to the ADX(7/21/28) panels) in ~30 min. - BOCPD is promoted + live (
ml/forecast/bocpd_live.py) - lay changepoint markers over the ADX blocks to see structural breaks. - HMM vol state as a second, orthogonal layer: ADX says "trend yes/no + direction", HMM says "calm/turbulent". Together they form a 2D regime map (e.g. "turbulent uptrend" vs. "calm range") that is far more informative for sizing/stops than ADX alone.
Related Botty artifacts
- Live filter:
indicators/regime.py(ADX+DMI+hysteresis), UI/regime - Glossary: ADX, DMI
- Experiments:
/ml#experiments/hmm_regime,bocpd,regime_clustering,vol_regime_transitions - Vol forecast:
ml/forecast/(CLAUDE.md)
Update 2026-06-10: from detecting to using - filter, not switch
The research above answers which lenses exist. The follow-up question was: how do you use a more robust regime signal in a trading strategy? Three candidates were on the table - and Botty's own data settled the ranking.
Option 1: regime switch - sounds elegant, is empirically dead
The most seductive idea: one strategy that switches itself - a trend strategy as long as the regime says "trend", mean-reversion in the range. We built exactly that and tested it in the Indicator Lab (regime_switch: SFP in trend / BB extremes in range, switched by the ADX/DMI regime). Result: -392 bps per trade on a 24-bar horizon (t=-3.69), parameter plateau 0% - not a single positive cell across the entire grid.
Why, in plain words: a switch can only harvest what is there. It only pays off when both sub-strategies have a real, oppositely regime-dependent edge on their own - then it reaps both. If they have none (and our parts had none), the switch combines two zeros while doubling the number of parameters you can overfit to. The classifier was never the problem - the parts were. The switch therefore stays the last step, not the first.
Option 2: regime filter (gate) - the right first step
With a filter the entry stays the boss: it decides when a trade would be taken. The regime gate only decides whether the trade may happen. Trend entry? Only if the gate says "trend". Mean-reversion? Only in "range".
The honest footnote, precisely: a filter creates no edge - it cuts samples away. It can only improve a strategy if that strategy's edge is regime-conditional (good in trend, bad in range - or vice versa). Exactly this "ceiling with a perfect regime filter" is what Stage 1 in the Indicator Lab measures before we wire up a gate. In plain words: a better bouncer does not make a better party. It only helps if there is actually a party going on inside - and something that would actually be disrupted outside.
Why a majority vote instead of AND-stacking - the new regime_ensemble_filter
Botty's sweep machinery could always stack filters: ADX gate AND ER gate on top of each other. But stacking means both have to agree (2-of-2). That has an ugly property: a single lens trembling at its threshold (ADX oscillating around 20 ...) paralyzes the whole gate - even though the other two lenses agree.
A real 2-of-3 majority vote - one dissenting lens is forgiven - is a form that in principle cannot be built from stacked single filters. That is why it now exists as its own condition: regime_ensemble_filter.
How it works, step by step:
- Three mathematically independent lenses look at the same candles: Wilder ADX (smoothed directional movement), Kaufman Efficiency Ratio (net path / total path traveled) and Dreiss Choppiness Index (ATR path vs. high-low span). Three different maths - whoever agrees here does not agree for the same reason.
- Each lens casts one vote per candle: "trend" or not. At the moderate operating point: ADX>=20, ER>=0.30, CHOP<=55.
- From 2 of 3 votes on, the gate is open. That is all. (Adjustable: 2 = majority, 3 = unanimous; and mirror-inverted the gate counts range votes for mean-reversion entries.)
In plain words: three doctors with three different diagnostic methods look at the same patient. Surgery happens if at least two say "yes". A single doctor having a bad day can neither force nor block the operation.
The chart shows this on real BTC daily candles: on top the price with the gate state (turquoise = unanimous 3/3, yellow = the 2/3 cases where exactly one lens is forgiven, grey = gate closed), in the middle the three ballot strips, at the bottom the simple vote sum against the threshold:
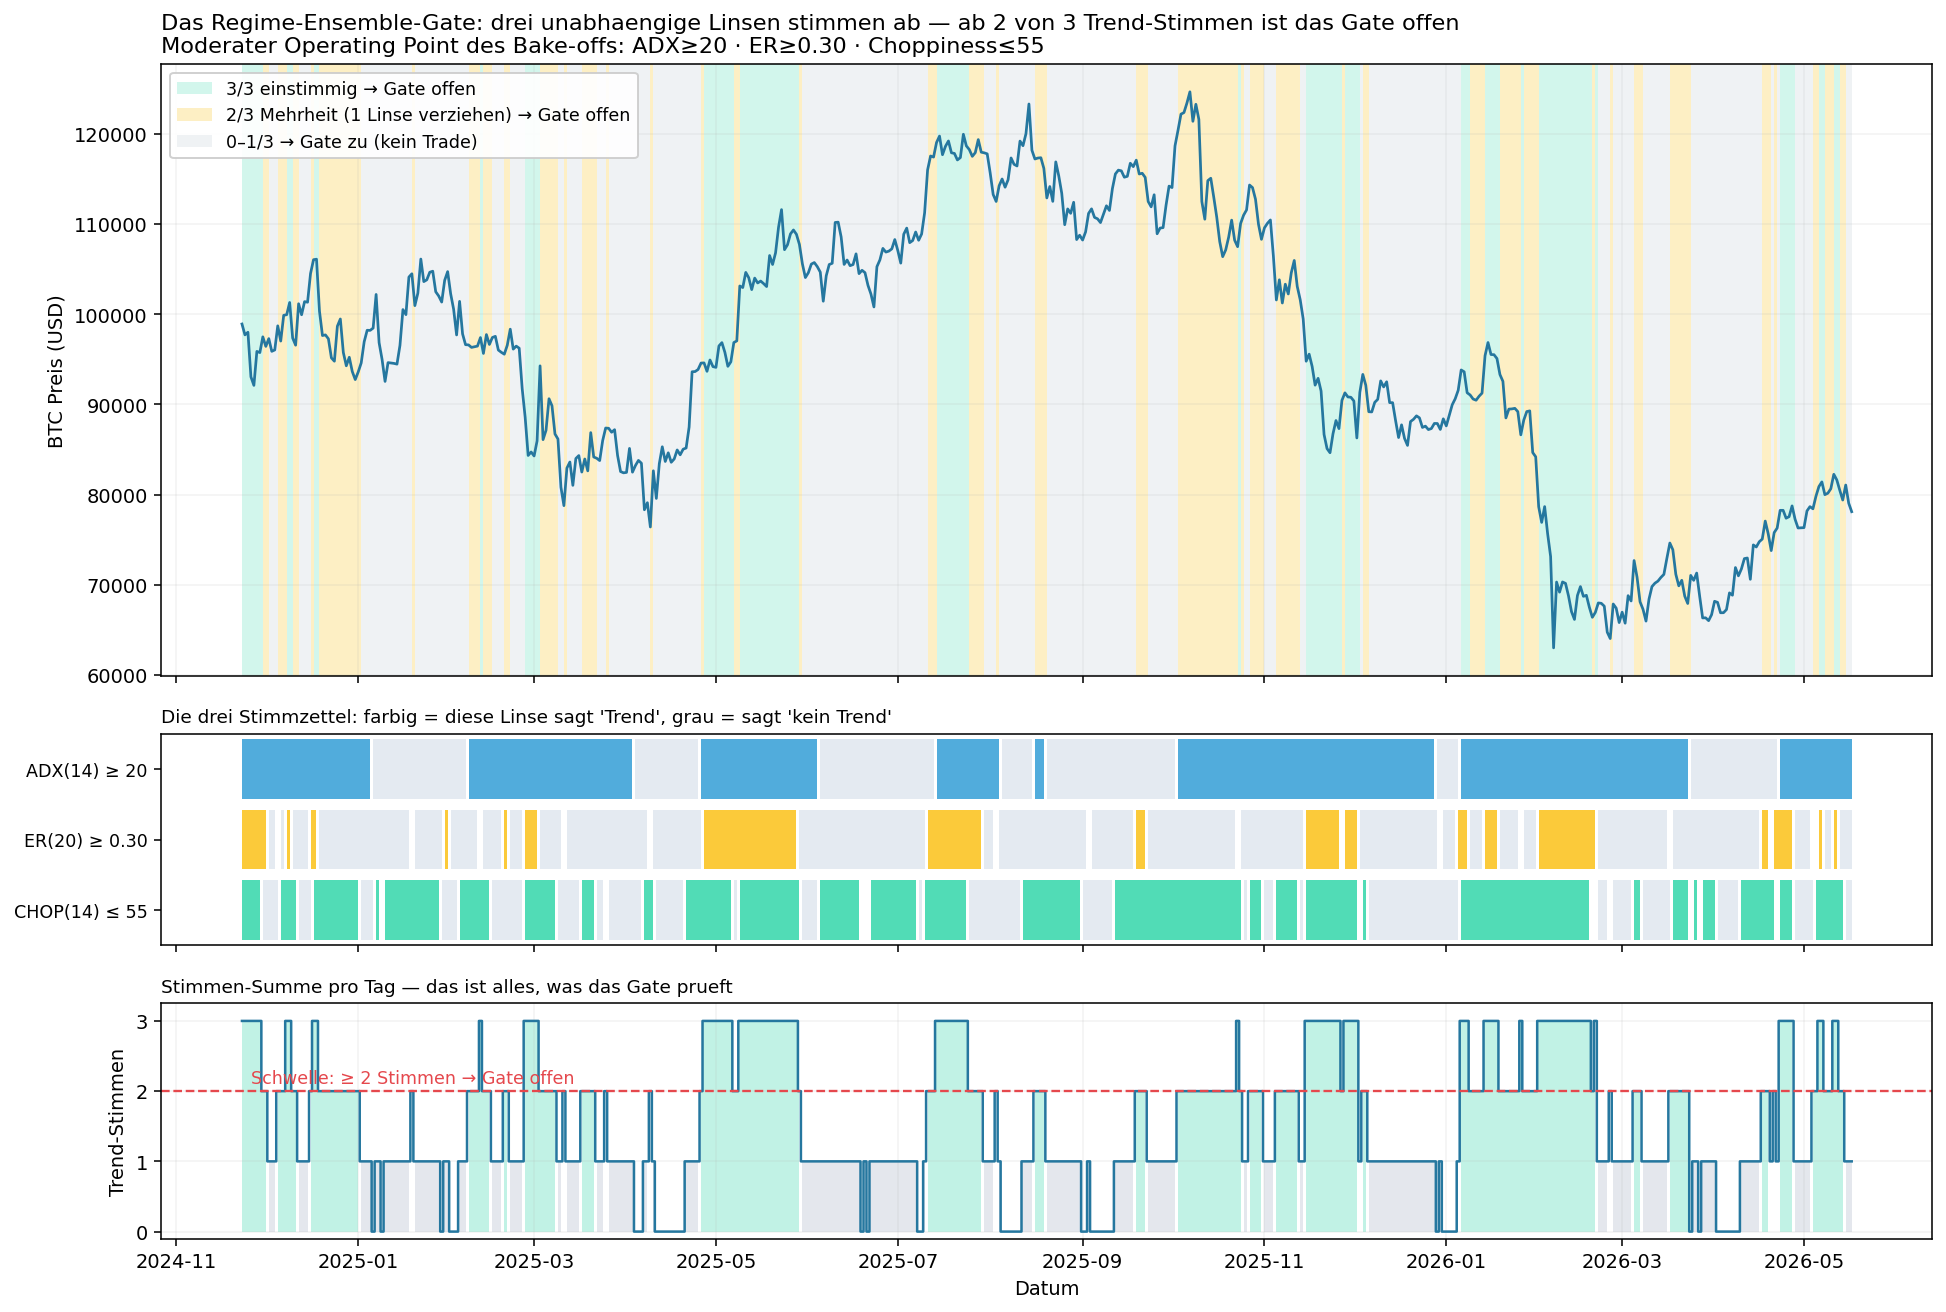
Over the last 540 days the votes distribute like this: 0 votes 10% - 1 vote 42% - 2 votes 27% - 3 votes 21% - gate open on 48% of days. The 27% are the heart of the argument: every fourth day is a 2-of-3 case that an AND-stack would decide differently (or not at all) depending on the pair of lenses.
Why we let the winner fight it out in a bake-off instead of trusting the theory
"An ensemble is more robust" is at first only a plausible story - and this project's mega-sweep history is a graveyard of plausible stories. That is why the question is decided empirically, with the preset regime_gate_bakeoff_v1:
- Identical trades: entry (ema_crossover - clearly beat Donchian in the last two sweeps), exits (fixed_stop + ATR trailing) and time periods are pinned. The only structural variable is the gate: none / ADX / ER / CHOP / ensemble, solo and pairwise.
- Fair thresholds: Phase 1 runs each gate at two operating points (moderate / strict), Phase 2 sweeps the thresholds and the vote count (2-of-3 vs. 3-of-3) - no gate wins just because it happened to have the better default setting.
- The referee is out-of-sample: trained on 2024+2025, evaluated on 2021/2022/2023 incl. the LUNA/FTX crash, plus a PBO check. The winner is the gate that lifts the edge most stably over unknown data - not the one with the prettiest training curve.
In plain words: we let four bouncers guard the same club on the same nights and afterwards count who had the fewest brawls and the most good guests coming in - instead of trusting the bouncer with the best resume.
Status: the gate is built and triple-verified (vote math on real bars, sweep-queue generation, a complete live-sim run: 18 baseline trades -> 2 filtered, removing the whipsaw losers). The bake-off sits ready in the preset queue and starts as soon as the running sweep is done. In parallel, the insight from above stays valid unchanged: the proven regime edge lies on the volatility axis - vol-forecast sizing and the BOCPD veto are the second, independent strand.