BOCPD — Bayesian Online Change-Point Detection
PromotedBOCPD — Bayesian Online Change-Point Detection
2026-05-19 · status: promoted · 31.1s
Hypothesis: BOCPD on 15m standardised returns produces P(short-run-length) and E[run-length] features that predict elevated forward 4h realized vol. Spearman IC of
P(short-run)vs forward 4h vol ≥ 0.05 walk-forward.Verdict: PROMOTE —
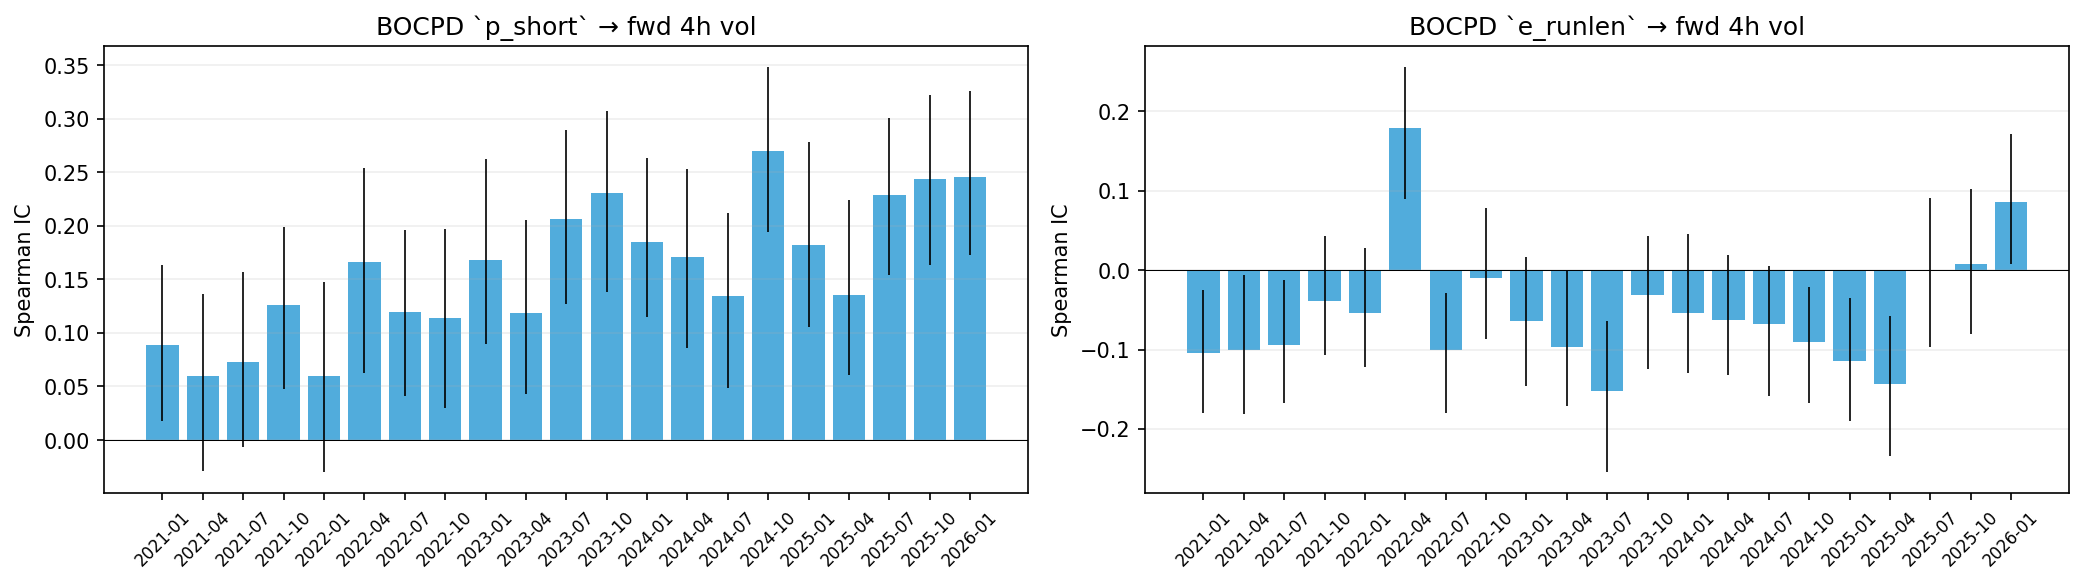
p_shortIC = +0.1601, positive in 21/21 windows. Bars in fresh-change-point regime show +26.7% higher forward 4h vol than baseline. Add as feature for vol-forecast / Master-LGBM.
Key metrics
| metric | value |
|---|---|
| pooled_IC_p_short | +0.1601 |
| pooled_CI_p_short | [+0.1434, +0.1752] |
| pooled_IC_e_runlen | +0.0448 |
| pooled_n | 13,953 |
| windows_pos_p_short | 21 |
| n_windows | 21 |
| stability | +1.0000 |
| fwd_vol_uplift_pct | +26.7297 |
| n_high_cp_bars | 3,212 |
| pct_high_cp | +1.4388 |
Approach
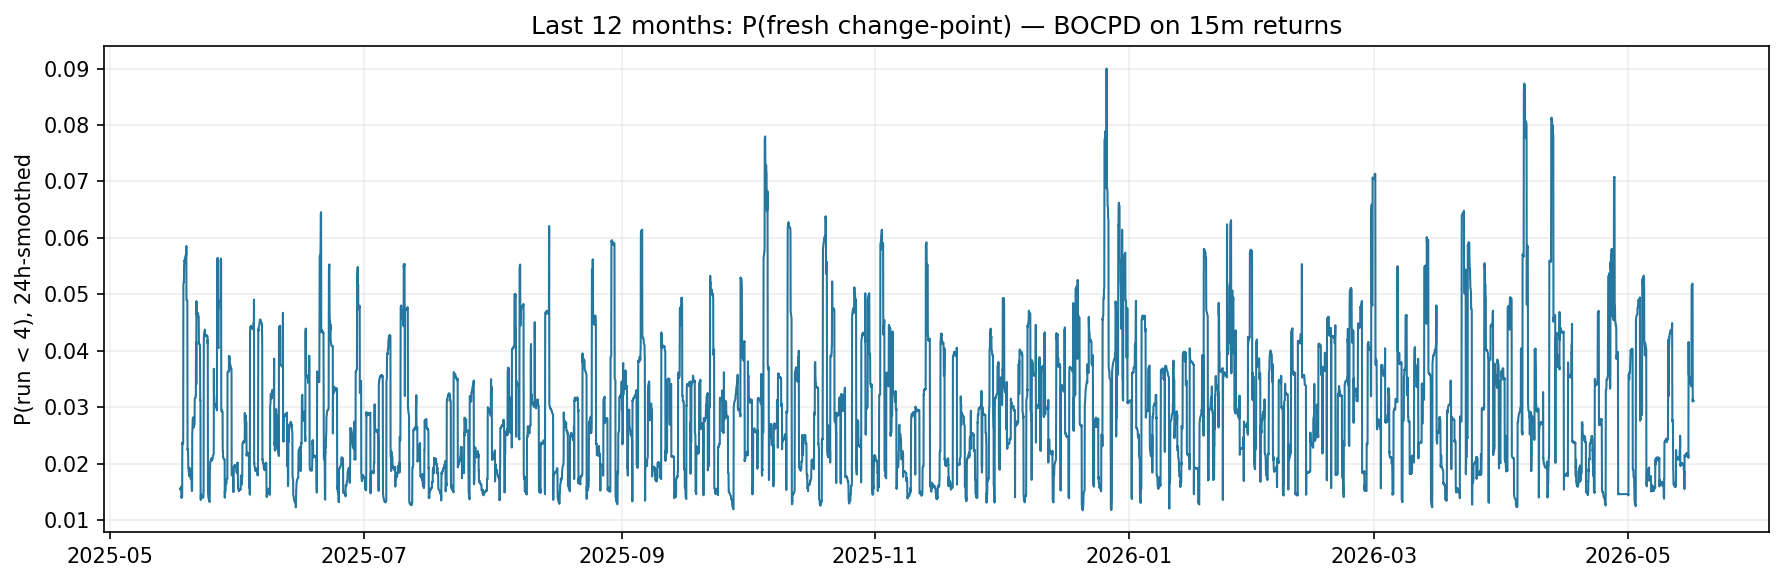
BOCPD with Normal-Inverse-Gamma prior (conjugate; Student-T predictive) on 15m standardised log returns z = r / rolling_std(r, 96 bars = 24h). Constant hazard H = 1/96 (≈ 1 expected change-point per day). Run-length truncated at R_max = 200 (≈ 50h memory).
Features:
- p_short = P(run_length < 4) — fresh-changepoint indicator
- e_runlen = E[run_length] — system stability measure
Label: realized vol of next 4h. Sampled every 16 bars (4h) for IC independence. Walk-forward: 12mo train / 3mo test, embargo = 1440 min.
Pooled OOS IC
-
p_short→ fwd_4h_vol: +0.1601 (n=13,953, 95% CI [+0.1434, +0.1752], p=8.41e-81) -
e_runlen→ fwd_4h_vol: +0.0448 (n=13,953, 95% CI [+0.0286, +0.0611], p=1.23e-07)
Change-point regime conditional
-
Bars with
p_short > 0.5: 3,212 (1.44% of valid samples) -
Mean fwd 4h vol when
p_short > 0.5: 0.00339 -
Baseline mean fwd 4h vol: 0.00267
-
Uplift: +26.7%
Per-window IC — p_short (21 windows)
| window | n | IC | ci_low | ci_high | p_value |
|---|---|---|---|---|---|
| 2021-01-02 → 2021-04-02 | 540 | 0.089 | 0.0176 | 0.1634 | 0.0388 |
| 2021-04-02 → 2021-07-02 | 546 | 0.0594 | -0.0294 | 0.1359 | 0.1659 |
| 2021-07-02 → 2021-10-02 | 552 | 0.0732 | -0.0063 | 0.1565 | 0.0856 |
| 2021-10-02 → 2022-01-02 | 552 | 0.126 | 0.0474 | 0.1986 | 0.003 |
| 2022-01-02 → 2022-04-02 | 540 | 0.0597 | -0.0302 | 0.1479 | 0.1659 |
| 2022-04-02 → 2022-07-02 | 546 | 0.1666 | 0.0624 | 0.2537 | 0.0001 |
| 2022-07-02 → 2022-10-02 | 552 | 0.1192 | 0.0413 | 0.196 | 0.0051 |
| 2022-10-02 → 2023-01-02 | 552 | 0.1135 | 0.0302 | 0.1966 | 0.0076 |
| 2023-01-02 → 2023-04-02 | 540 | 0.1682 | 0.09 | 0.2624 | 0.0001 |
| 2023-04-02 → 2023-07-02 | 546 | 0.1183 | 0.0433 | 0.2058 | 0.0056 |
| 2023-07-02 → 2023-10-02 | 552 | 0.206 | 0.127 | 0.289 | 0 |
| 2023-10-02 → 2024-01-02 | 552 | 0.2309 | 0.1386 | 0.3072 | 0 |
| 2024-01-02 → 2024-04-02 | 546 | 0.1845 | 0.1147 | 0.2632 | 0 |
| 2024-04-02 → 2024-07-02 | 546 | 0.1709 | 0.0855 | 0.253 | 0.0001 |
| 2024-07-02 → 2024-10-02 | 552 | 0.1343 | 0.0487 | 0.2117 | 0.0016 |
| 2024-10-02 → 2025-01-02 | 552 | 0.2696 | 0.1943 | 0.3485 | 0 |
| 2025-01-02 → 2025-04-02 | 540 | 0.1822 | 0.1056 | 0.2784 | 0 |
| 2025-04-02 → 2025-07-02 | 546 | 0.1357 | 0.061 | 0.2238 | 0.0015 |
| 2025-07-02 → 2025-10-02 | 552 | 0.229 | 0.1541 | 0.301 | 0 |
| 2025-10-02 → 2026-01-02 | 552 | 0.2434 | 0.1637 | 0.3219 | 0 |
| 2026-01-02 → 2026-04-02 | 540 | 0.2456 | 0.1731 | 0.3255 | 0 |
Per-window IC — e_runlen (21 windows)
| window | n | IC | ci_low | ci_high | p_value |
|---|---|---|---|---|---|
| 2021-01-02 → 2021-04-02 | 540 | -0.1043 | -0.1795 | -0.0246 | 0.0153 |
| 2021-04-02 → 2021-07-02 | 546 | -0.1003 | -0.1809 | -0.0059 | 0.0191 |
| 2021-07-02 → 2021-10-02 | 552 | -0.0944 | -0.1674 | -0.0124 | 0.0266 |
| 2021-10-02 → 2022-01-02 | 552 | -0.0383 | -0.1068 | 0.0431 | 0.3687 |
| 2022-01-02 → 2022-04-02 | 540 | -0.0545 | -0.1217 | 0.0285 | 0.2059 |
| 2022-04-02 → 2022-07-02 | 546 | 0.1793 | 0.0903 | 0.2565 | 0 |
| 2022-07-02 → 2022-10-02 | 552 | -0.1009 | -0.1797 | -0.029 | 0.0177 |
| 2022-10-02 → 2023-01-02 | 552 | -0.0103 | -0.0863 | 0.0778 | 0.8089 |
| 2023-01-02 → 2023-04-02 | 540 | -0.0647 | -0.1464 | 0.0167 | 0.1334 |
| 2023-04-02 → 2023-07-02 | 546 | -0.0963 | -0.171 | -0.0002 | 0.0245 |
| 2023-07-02 → 2023-10-02 | 552 | -0.152 | -0.2548 | -0.0637 | 0.0003 |
| 2023-10-02 → 2024-01-02 | 552 | -0.0313 | -0.1247 | 0.0433 | 0.4625 |
| 2024-01-02 → 2024-04-02 | 546 | -0.0541 | -0.13 | 0.045 | 0.2069 |
| 2024-04-02 → 2024-07-02 | 546 | -0.063 | -0.1326 | 0.019 | 0.1412 |
| 2024-07-02 → 2024-10-02 | 552 | -0.068 | -0.1588 | 0.0057 | 0.1104 |
| 2024-10-02 → 2025-01-02 | 552 | -0.0906 | -0.1676 | -0.0217 | 0.0332 |
| 2025-01-02 → 2025-04-02 | 540 | -0.1138 | -0.1907 | -0.0351 | 0.0081 |
| 2025-04-02 → 2025-07-02 | 546 | -0.1439 | -0.2336 | -0.0578 | 0.0007 |
| 2025-07-02 → 2025-10-02 | 552 | 0.0001 | -0.0964 | 0.0909 | 0.9984 |
| 2025-10-02 → 2026-01-02 | 552 | 0.0082 | -0.0807 | 0.1024 | 0.8473 |
| 2026-01-02 → 2026-04-02 | 540 | 0.0859 | 0.0077 | 0.1713 | 0.0459 |