Direction Stage 1.5 — GBM with macro/sentiment features
DroppedDirection Stage 1.5 — GBM with macro/sentiment features
2026-05-17 · status: dropped · 12.3s
Hypothesis: Adding Fear & Greed sentiment, funding-rate positioning, and ETH/SOL cross-asset features lifts the baseline GBM's IC above +0.02 and the long-short spread above 15 bps — closing the gap toward a tradeable directional edge.
Verdict: MACRO ADDS NOTHING — IC +0.0161 vs Stage 1 +0.0148 (lift +0.0013), L/S spread +3.6 bps. Sentiment + funding + cross-asset don't extract a directional edge on this data. The honest answer: vol-targeting is the ceiling; pivot to live-trading + accumulating better data (Binance snapshot collector) for future iterations.
Key metrics
| metric | value |
|---|---|
| n_features_total | 47 |
| n_features_macro | 14 |
| n_windows | 21 |
| pooled_IC | +0.0161 |
| pooled_IC_CI | [-0.0010, +0.0337] |
| IC_lift_vs_stage1 | +0.0013 |
| long_short_bps | +3.5769 |
| long_short_t_stat | +0.9293 |
| spread_lift_vs_stage1 | -1.6231 |
| positive_IC_rate_pct | +85.7143 |
| gates_passed | 1 |
| gates_total | 3 |
Approach
Same GBM (HistGradientBoosting, 200 iter, depth 4, lr 0.05) and same walk-forward scheme as Stage 1 — only the feature set is bigger.
- Base features (33): OHLCV-derived from
direction_baseline - Macro features (14):
fng_value, fng_chg_7d, fng_z_30d, fng_extreme, fr, fr_z_30d, fr_cum_3d, fr_cum_7d, eth_btc_log_ratio, eth_btc_ret_4h, eth_btc_corr_24h, btc_eth_vol_spread, sol_btc_log_ratio, sol_btc_ret_4h
Source historical depth: - Fear & Greed: 2018-02 → today (daily) - Funding rate: 2023-05 → today (8h settlements) — NaN in earlier windows - ETH/SOL: 2020-01 → today (1m); SOL starts 2020-09
HistGBR handles NaN natively (treats missing as its own split direction), so windows before funding data exists still train cleanly — they just can't use the funding features.
Stage 1 reference: pooled IC +0.0148, L/S spread +5.2 bps, stability 76.2%.
1. Walk-forward IC
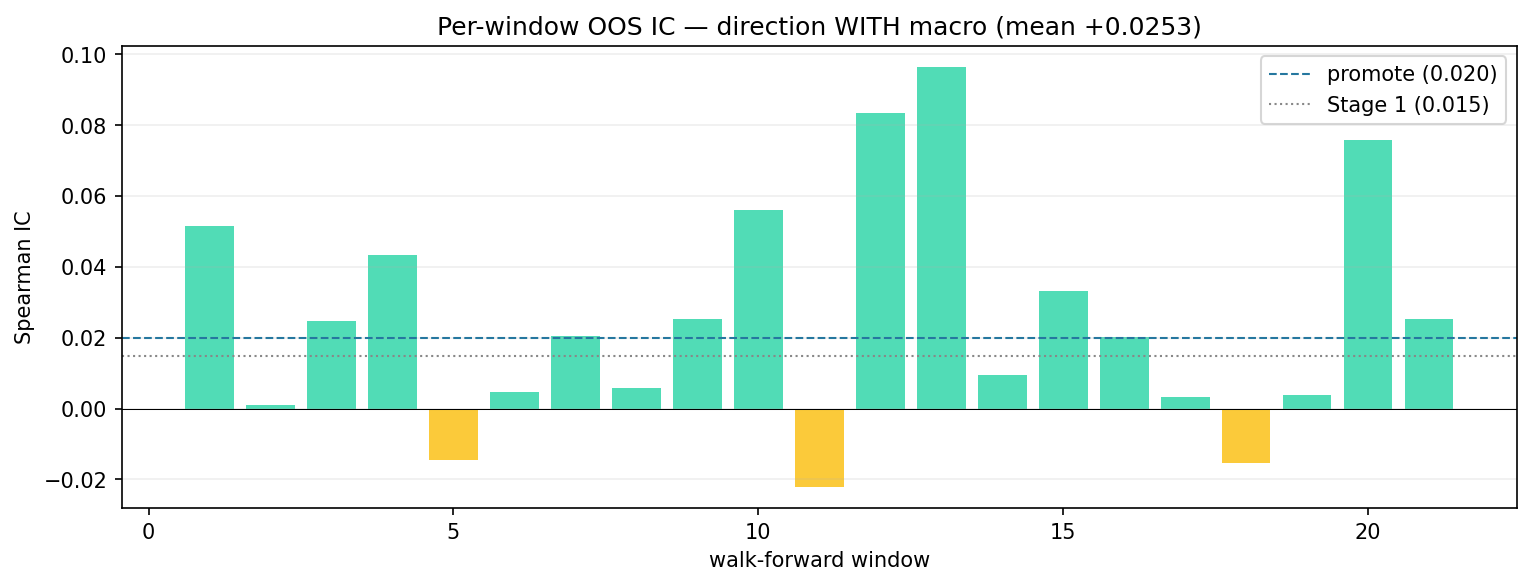
- Pooled Spearman IC (non-overlapping 4h): +0.0161 (n = 11,496, 95% CI [-0.0010, +0.0337])
- Per-window IC: min -0.0221, max +0.0964, mean +0.0253
- Positive-IC windows: 18 / 21 (85.7%)
- Delta vs Stage 1: IC +0.0013 | stability +9.5 pp
| window | test_start | test_end | n | IC |
|---|---|---|---|---|
| 1 | 2021-01-05 | 2021-04-05 | 2160 | 0.0514 |
| 2 | 2021-04-05 | 2021-07-05 | 2184 | 0.001 |
| 3 | 2021-07-05 | 2021-10-05 | 2208 | 0.0246 |
| 4 | 2021-10-05 | 2022-01-05 | 2208 | 0.0433 |
| 5 | 2022-01-05 | 2022-04-05 | 2160 | -0.0146 |
| 6 | 2022-04-05 | 2022-07-05 | 2184 | 0.0046 |
| 7 | 2022-07-05 | 2022-10-05 | 2208 | 0.0205 |
| 8 | 2022-10-05 | 2023-01-05 | 2208 | 0.0058 |
| 9 | 2023-01-05 | 2023-04-05 | 2160 | 0.0252 |
| 10 | 2023-04-05 | 2023-07-05 | 2184 | 0.056 |
| 11 | 2023-07-05 | 2023-10-05 | 2208 | -0.0221 |
| 12 | 2023-10-05 | 2024-01-05 | 2208 | 0.0833 |
| 13 | 2024-01-05 | 2024-04-05 | 2184 | 0.0964 |
| 14 | 2024-04-05 | 2024-07-05 | 2184 | 0.0095 |
| 15 | 2024-07-05 | 2024-10-05 | 2208 | 0.0332 |
| 16 | 2024-10-05 | 2025-01-05 | 2207 | 0.0202 |
| 17 | 2025-01-05 | 2025-04-05 | 2160 | 0.0034 |
| 18 | 2025-04-05 | 2025-07-05 | 2184 | -0.0154 |
| 19 | 2025-07-05 | 2025-10-05 | 2208 | 0.0039 |
| 20 | 2025-10-05 | 2026-01-05 | 2208 | 0.0757 |
| 21 | 2026-01-05 | 2026-04-05 | 2160 | 0.0254 |
2. Quintile spread (raw 4h returns)
| q | n | mean_target_norm | mean_bps | se_bps | t_stat |
|---|---|---|---|---|---|
| 0 | 2300 | 0.0106 | -0.15 | 2.56 | -0.06 |
| 1 | 2299 | -0.0336 | -2.15 | 2.4 | -0.9 |
| 2 | 2299 | -0.0011 | -1.36 | 2.65 | -0.51 |
| 3 | 2299 | 0.0318 | 3.45 | 2.71 | 1.27 |
| 4 | 2299 | 0.0073 | 3.42 | 2.87 | 1.19 |
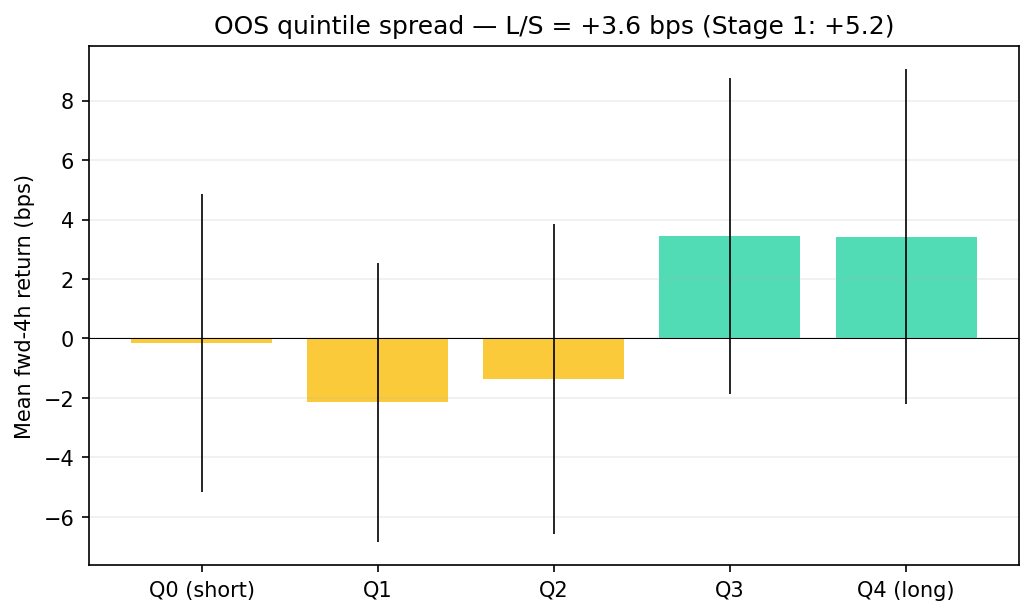
- Long-short spread Q4 - Q0: +3.6 bps (SE ≈ 3.85, t ≈ +0.93)
- Delta vs Stage 1: -1.6 bps
3. Permutation importance (last test window)
Computed by shuffling each feature's values and measuring R² drop. Macro features are highlighted via the is_macro column. Higher = more informative.
| feature | importance | std | is_macro |
|---|---|---|---|
| fr_cum_7d | 0.01173 | 0.00431 | True |
| kurt_1d | 0.0038 | 0.00244 | False |
| range_4h | 0.00298 | 0.00058 | False |
| rv_240m | 0.00279 | 0.00067 | False |
| rv_60m | 0.00255 | 0.00041 | False |
| fr_z_30d | 0.00218 | 0.00343 | True |
| hour_cos | 0.00184 | 0.00318 | False |
| dow | 0.00152 | 0.00045 | False |
| dd_1d | 0.00124 | 0.00146 | False |
| pk_vol_240m | 0.00124 | 0.00114 | False |
| hour_of_day | 0.0012 | 0.00097 | False |
| log_vol | 0.00113 | 0.00017 | False |
| ret_5m | 0.00095 | 0.00119 | False |
| fng_z_30d | 0.00069 | 0.00088 | True |
| vol_z_1d | 0.00053 | 0.00086 | False |
| vol_z_1h | 0.00027 | 0.00071 | False |
| hour_sin | 0.00015 | 0.00049 | False |
| is_weekend | 0 | 0 | False |
| fng_extreme | 0 | 0 | True |
| ret_15m | -6e-05 | 4e-05 | False |
- Macro features total importance: -0.00769 (-0.8% of positive importance)
- Base features total importance: -0.06495 (-6.5%)
Production gates
| gate | pass? | actual |
|---|---|---|
| pooled IC > 0.020 | FAIL | +0.0161 |
| quintile spread > 15 bps | FAIL | +3.6 bps |
| positive IC in ≥ 70% windows | OK | 85.7% |
Passed: 1/3
Lifts vs Stage 1: IC +0.0013, spread -1.6 bps.