DVOL/Realised Vol Spread — BTC Variance Risk Premium
PromotedDVOL/Realised Vol Spread — BTC Variance Risk Premium
2026-05-19 · status: promoted · 1.8s
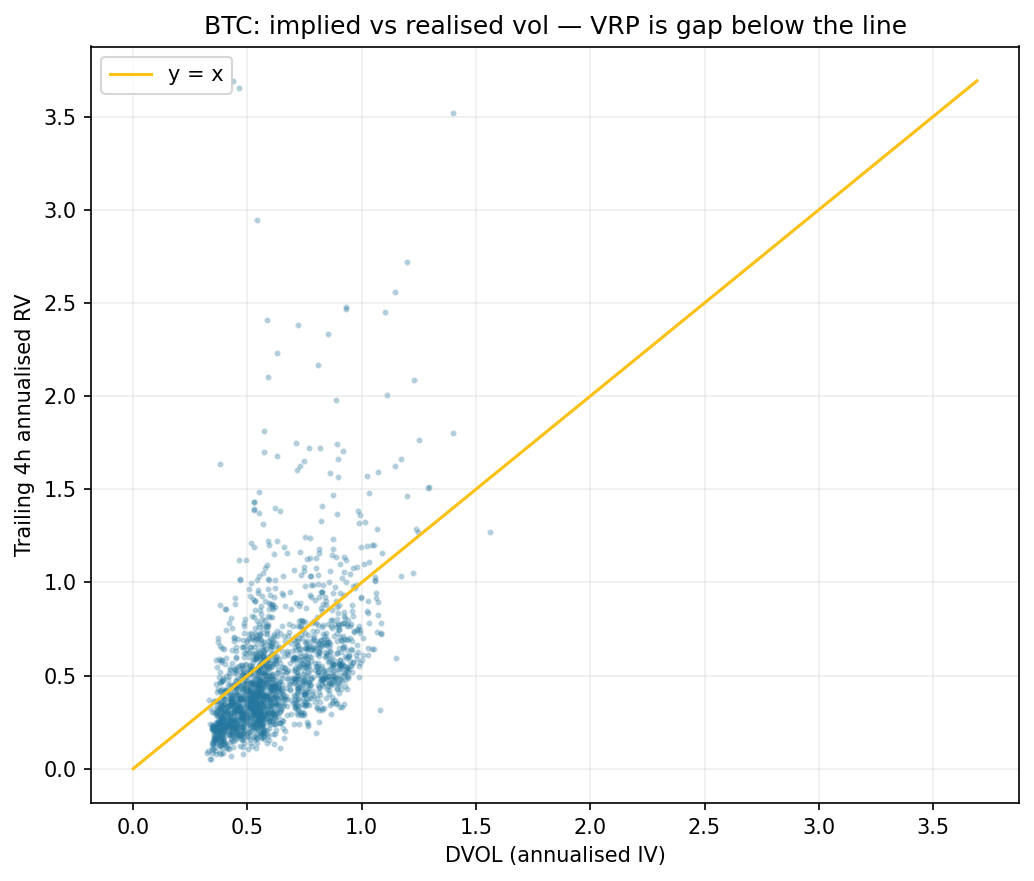
Hypothesis: Variance Risk Premium VRP = DVOL_implied − RV_realised predicts forward 4h realized vol with negative Spearman IC ≥ 0.05 in magnitude walk-forward. High VRP → vol mean-reverts down; low VRP → vol spikes up.
Verdict: PROMOTE — VRP IC = -0.2772 (negative as predicted), negative in 16/16 windows, ΔRV spread Q5−Q1 = +34.0%. VRP is a robust mean-reversion signal for 4h vol.
Key metrics
| metric | value |
|---|---|
| pooled_IC | -0.2772 |
| pooled_CI | [-0.3159, -0.2315] |
| pooled_n | 1,878 |
| windows_neg | 16 |
| n_windows | 16 |
| delta_rv_spread_q5_minus_q1_pct | +33.9909 |
Approach
DVOL daily close → annualised IV (= DVOL/100). Forward-fill onto 4h BTC bars. Realised 4h annualised vol = std(1m log returns over 4h) · √525600. VRP = IV − RV. Label: realised 4h ann vol starting at t+1. Sampled every 6 bars (~24h) for IC bootstrap independence. Walk-forward 12mo/3mo, embargo 1440 min.
Expected sign: Spearman IC of VRP → fwd RV should be negative (high VRP = market overpricing vol = realised will come down).
Pooled OOS IC (VRP → fwd 4h RV ann)
-
Spearman IC:
-0.2772(n=1,878) -
95% CI:
[-0.3159, -0.2315] -
p-value:
1.8e-34
Quintile table — fwd 4h RV ann by VRP quintile
| quantile | count | mean_pct | std_pct |
|---|---|---|---|
| 0 | 376 | 69.32 | 42.8 |
| 1 | 375 | 45.66 | 22.6 |
| 2 | 376 | 41.38 | 22.14 |
| 3 | 375 | 39.04 | 22.51 |
| 4 | 376 | 44.21 | 33.65 |
Quintile table — ΔRV (fwd − current) by VRP quintile
| quantile | count | mean_delta_pct |
|---|---|---|
| 0 | 376 | -26.21 |
| 1 | 375 | -4.22 |
| 2 | 376 | 1.06 |
| 3 | 375 | 4.61 |
| 4 | 376 | 7.78 |
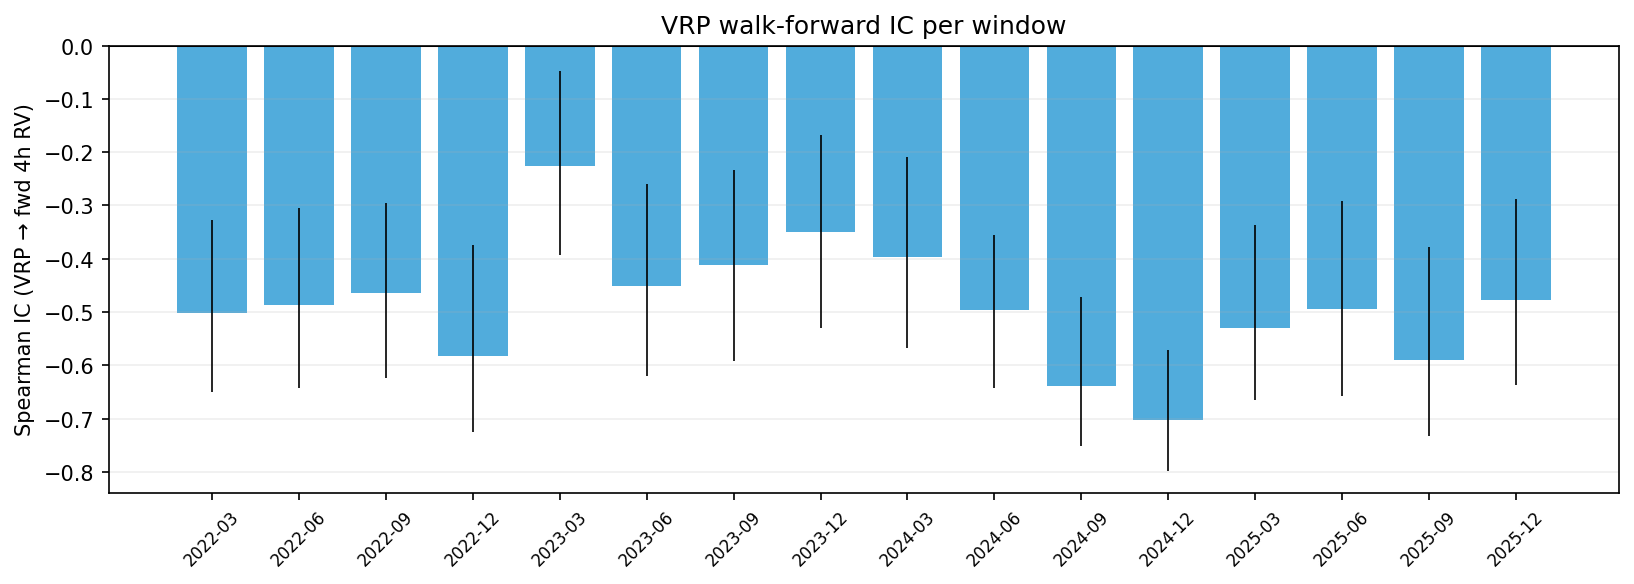
Per-window IC (16 windows)
| window | n | IC | ci_low | ci_high | p_value |
|---|---|---|---|---|---|
| 2022-03-25 → 2022-06-25 | 92 | -0.5025 | -0.6501 | -0.3274 | 0 |
| 2022-06-25 → 2022-09-25 | 92 | -0.4865 | -0.6423 | -0.3051 | 0 |
| 2022-09-25 → 2022-12-25 | 91 | -0.4647 | -0.6232 | -0.2944 | 0 |
| 2022-12-25 → 2023-03-25 | 90 | -0.5815 | -0.7248 | -0.3748 | 0 |
| 2023-03-25 → 2023-06-25 | 92 | -0.2251 | -0.3933 | -0.0474 | 0.031 |
| 2023-06-25 → 2023-09-25 | 92 | -0.4517 | -0.6202 | -0.26 | 0 |
| 2023-09-25 → 2023-12-25 | 91 | -0.4107 | -0.591 | -0.2339 | 0.0001 |
| 2023-12-25 → 2024-03-25 | 91 | -0.3492 | -0.5303 | -0.1672 | 0.0007 |
| 2024-03-25 → 2024-06-25 | 92 | -0.3964 | -0.5668 | -0.2094 | 0.0001 |
| 2024-06-25 → 2024-09-25 | 92 | -0.4962 | -0.6424 | -0.3561 | 0 |
| 2024-09-25 → 2024-12-25 | 91 | -0.6388 | -0.7512 | -0.4708 | 0 |
| 2024-12-25 → 2025-03-25 | 90 | -0.702 | -0.7985 | -0.571 | 0 |
| 2025-03-25 → 2025-06-25 | 92 | -0.5304 | -0.6652 | -0.3373 | 0 |
| 2025-06-25 → 2025-09-25 | 92 | -0.4946 | -0.657 | -0.292 | 0 |
| 2025-09-25 → 2025-12-25 | 91 | -0.5906 | -0.7331 | -0.3774 | 0 |
| 2025-12-25 → 2026-03-25 | 90 | -0.4768 | -0.6369 | -0.288 | 0 |