Vol-clustering forecast
PromotedVol-clustering forecast
2026-05-17 · status: promoted · 12.5s
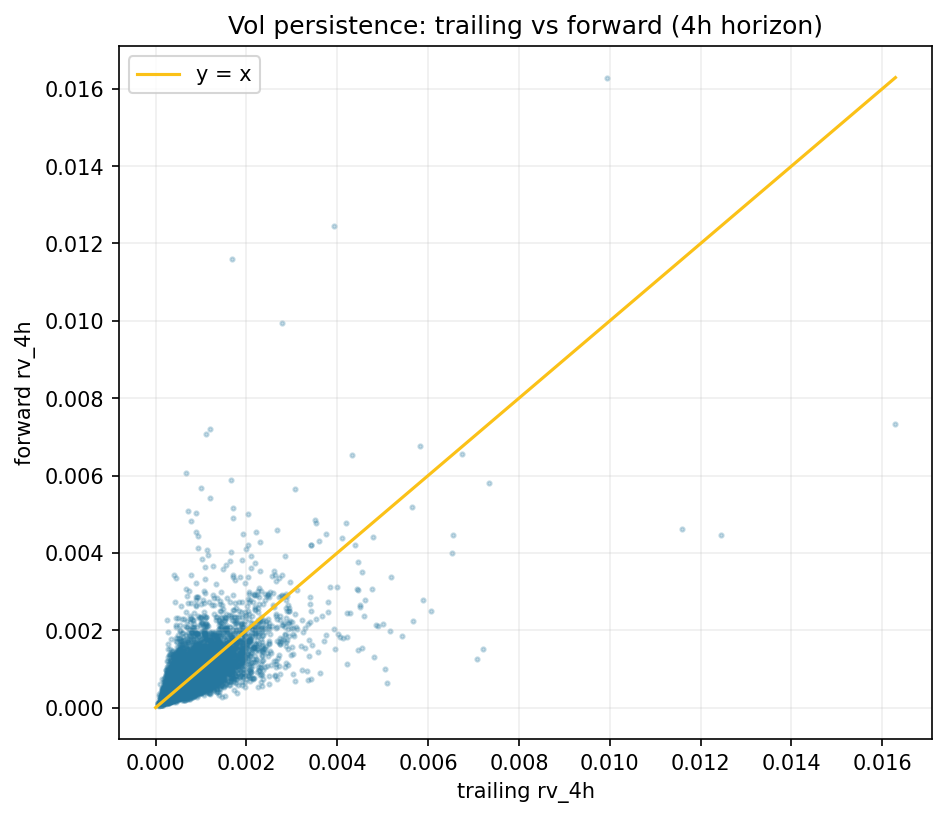
Hypothesis: Trailing realized volatility predicts forward realized volatility — i.e. vol persists. Tested at 1h, 4h, 24h horizons walk-forward.
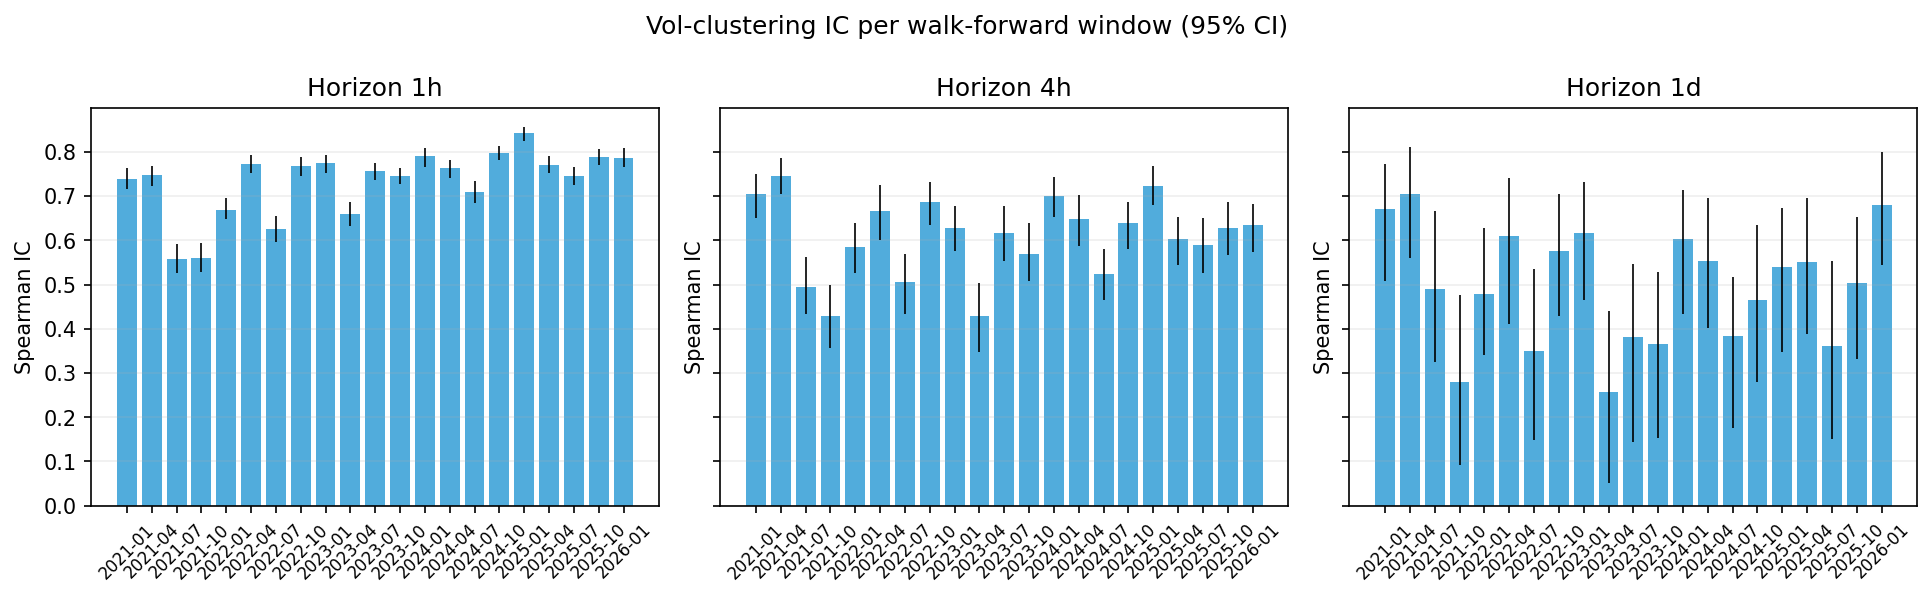
Verdict: PROMOTE — vol persistence is strong (4h IC = +0.736, positive in every walk-forward window). Build a vol-forecasting model and use it for position sizing or entry filtering.
Key metrics
| metric | value |
|---|---|
| IC_1h | +0.8140 |
| IC_4h | +0.7359 |
| IC_1d | +0.7225 |
| IC_4h_CI | [+0.7265, +0.7453] |
| windows_pos | 21 |
| total_windows | 21 |
In einfachen Worten
Stell dir BTC wie das Wetter vor. Wir können nicht zuverlässig vorhersagen, ob es morgen steigt oder fällt — die Richtung ist fast pures Rauschen. Aber wir können vorhersagen, wie wild es sich bewegen wird. Wenn die letzten 4 Stunden ruhig waren, sind die nächsten 4 Stunden mit hoher Wahrscheinlichkeit auch ruhig. Wenn es gerade tobt, tobt es weiter.
Unsere Messung: der Zusammenhang zwischen Vergangenheits-Vol und Zukunfts-Vol ist +0.74 auf einer Skala von -1 (perfekt invers) bis +1 (perfekt). Das ist riesig für Finanzdaten — und vor allem: das gilt in jedem einzelnen der 21 Walk-Forward-Fenster der letzten 6 Jahre, nicht nur im Mittel.
Wie wir das praktisch nutzen
Wir bauen keine "Vol-Strategie", die direkt auf Volatilität wettet. Stattdessen ist der Forecast ein Regler für unsere bestehenden Strategien:
- Positionsgröße — bei niedrigem vorhergesagtem Vol: größere Position (gleiches $-Risiko, mehr Kontrakte). Bei hohem Vol: kleinere Position. Klassisches vol targeting.
- Stop-Loss-Distanz — statt nur naivem ATR-Multiplikator skaliert der Stop mit der erwarteten Vol.
- Entry-Filter — wenn die nächsten 4h sehr ruhig werden, lohnen sich Trendfolger nicht (keine Bewegung = kein Profit). Wenn extrem wild, droht Whipsaw.
- Strategie-Routing — Trendstrategien (EMA-Crossover) brauchen Bewegung, Mean-Reversion (RSI) braucht Range. Der Forecast wählt aus.
Das ist ein verlässlicher Boden, auf dem die Strategien stehen — kein Glücksspiel.
Approach
For each horizon h we compute the trailing rv_h (std of 1-bar log returns over the past h bars) and forward rv_h (the same over the next h bars). We sample every h bars to avoid heavy autocorrelation, then compute Spearman IC per walk-forward test window (12mo train / 3mo test, 1-day embargo).
Walk-forward windows: 21
-
train 2020-01-01 -> 2021-01-01 (527,040 bars) | test 2021-01-02 -> 2021-04-02 (129,600 bars)
-
train 2020-04-01 -> 2021-04-01 (525,600 bars) | test 2021-04-02 -> 2021-07-02 (131,040 bars)
-
train 2020-07-01 -> 2021-07-01 (525,600 bars) | test 2021-07-02 -> 2021-10-02 (132,480 bars)
-
train 2020-10-01 -> 2021-10-01 (525,600 bars) | test 2021-10-02 -> 2022-01-02 (132,480 bars)
-
train 2021-01-01 -> 2022-01-01 (525,600 bars) | test 2022-01-02 -> 2022-04-02 (129,600 bars)
-
train 2021-04-01 -> 2022-04-01 (525,600 bars) | test 2022-04-02 -> 2022-07-02 (131,040 bars)
-
train 2021-07-01 -> 2022-07-01 (525,600 bars) | test 2022-07-02 -> 2022-10-02 (132,480 bars)
-
train 2021-10-01 -> 2022-10-01 (525,600 bars) | test 2022-10-02 -> 2023-01-02 (132,480 bars)
-
train 2022-01-01 -> 2023-01-01 (525,600 bars) | test 2023-01-02 -> 2023-04-02 (129,600 bars)
-
train 2022-04-01 -> 2023-04-01 (525,600 bars) | test 2023-04-02 -> 2023-07-02 (131,040 bars)
-
train 2022-07-01 -> 2023-07-01 (525,600 bars) | test 2023-07-02 -> 2023-10-02 (132,480 bars)
-
train 2022-10-01 -> 2023-10-01 (525,600 bars) | test 2023-10-02 -> 2024-01-02 (132,480 bars)
-
train 2023-01-01 -> 2024-01-01 (525,600 bars) | test 2024-01-02 -> 2024-04-02 (131,040 bars)
-
train 2023-04-01 -> 2024-04-01 (527,040 bars) | test 2024-04-02 -> 2024-07-02 (131,040 bars)
-
train 2023-07-01 -> 2024-07-01 (527,040 bars) | test 2024-07-02 -> 2024-10-02 (132,480 bars)
-
train 2023-10-01 -> 2024-10-01 (527,040 bars) | test 2024-10-02 -> 2025-01-02 (132,480 bars)
-
train 2024-01-01 -> 2025-01-01 (527,040 bars) | test 2025-01-02 -> 2025-04-02 (129,600 bars)
-
train 2024-04-01 -> 2025-04-01 (525,600 bars) | test 2025-04-02 -> 2025-07-02 (131,040 bars)
-
train 2024-07-01 -> 2025-07-01 (525,600 bars) | test 2025-07-02 -> 2025-10-02 (132,480 bars)
-
train 2024-10-01 -> 2025-10-01 (525,600 bars) | test 2025-10-02 -> 2026-01-02 (132,480 bars)
-
train 2025-01-01 -> 2026-01-01 (525,600 bars) | test 2026-01-02 -> 2026-04-02 (129,600 bars)
Pooled results
| horizon | pooled_IC | pooled_CI_low | pooled_CI_high | pooled_n | windows_min_IC | windows_max_IC | windows_mean_IC | stable_pos | total_windows |
|---|---|---|---|---|---|---|---|---|---|
| 1h | 0.814 | 0.8105 | 0.8171 | 55,438 | 0.5571 | 0.8433 | 0.732 | 21 | 21 |
| 4h | 0.7359 | 0.7265 | 0.7453 | 13,858 | 0.4281 | 0.7455 | 0.6073 | 21 | 21 |
| 1d | 0.7225 | 0.7004 | 0.7434 | 2,308 | 0.2575 | 0.7047 | 0.4962 | 21 | 21 |
Per-window IC
1h horizon
| window | n | IC | ci_low | ci_high | p_value |
|---|---|---|---|---|---|
| 2021-01-02 → 2021-04-02 | 2160 | 0.7382 | 0.7165 | 0.7642 | 0 |
| 2021-04-02 → 2021-07-02 | 2184 | 0.7465 | 0.7227 | 0.7676 | 0 |
| 2021-07-02 → 2021-10-02 | 2208 | 0.5571 | 0.527 | 0.5905 | 0 |
| 2021-10-02 → 2022-01-02 | 2208 | 0.5609 | 0.5275 | 0.5935 | 0 |
| 2022-01-02 → 2022-04-02 | 2160 | 0.669 | 0.6473 | 0.6965 | 0 |
| 2022-04-02 → 2022-07-02 | 2184 | 0.7727 | 0.7512 | 0.7921 | 0 |
| 2022-07-02 → 2022-10-02 | 2208 | 0.6263 | 0.5957 | 0.6538 | 0 |
| 2022-10-02 → 2023-01-02 | 2208 | 0.7675 | 0.7445 | 0.7878 | 0 |
| 2023-01-02 → 2023-04-02 | 2160 | 0.7745 | 0.7532 | 0.793 | 0 |
| 2023-04-02 → 2023-07-02 | 2184 | 0.6593 | 0.6333 | 0.686 | 0 |
| 2023-07-02 → 2023-10-02 | 2208 | 0.7567 | 0.7354 | 0.7755 | 0 |
| 2023-10-02 → 2024-01-02 | 2208 | 0.7462 | 0.7263 | 0.7645 | 0 |
| 2024-01-02 → 2024-04-02 | 2184 | 0.7915 | 0.765 | 0.8085 | 0 |
| 2024-04-02 → 2024-07-02 | 2184 | 0.7642 | 0.7404 | 0.7819 | 0 |
| 2024-07-02 → 2024-10-02 | 2208 | 0.7101 | 0.6842 | 0.7331 | 0 |
| 2024-10-02 → 2025-01-02 | 2208 | 0.798 | 0.7807 | 0.8142 | 0 |
| 2025-01-02 → 2025-04-02 | 2160 | 0.8433 | 0.8254 | 0.856 | 0 |
| 2025-04-02 → 2025-07-02 | 2184 | 0.7696 | 0.7514 | 0.7906 | 0 |
| 2025-07-02 → 2025-10-02 | 2208 | 0.7461 | 0.7249 | 0.7659 | 0 |
| 2025-10-02 → 2026-01-02 | 2208 | 0.7876 | 0.7702 | 0.807 | 0 |
| 2026-01-02 → 2026-04-02 | 2160 | 0.787 | 0.7658 | 0.8078 | 0 |
4h horizon
| window | n | IC | ci_low | ci_high | p_value |
|---|---|---|---|---|---|
| 2021-01-02 → 2021-04-02 | 540 | 0.7048 | 0.6499 | 0.75 | 0 |
| 2021-04-02 → 2021-07-02 | 546 | 0.7455 | 0.7048 | 0.7868 | 0 |
| 2021-07-02 → 2021-10-02 | 552 | 0.4938 | 0.4338 | 0.563 | 0 |
| 2021-10-02 → 2022-01-02 | 552 | 0.4298 | 0.3571 | 0.499 | 0 |
| 2022-01-02 → 2022-04-02 | 540 | 0.5847 | 0.5253 | 0.6389 | 0 |
| 2022-04-02 → 2022-07-02 | 546 | 0.6671 | 0.6003 | 0.725 | 0 |
| 2022-07-02 → 2022-10-02 | 552 | 0.5051 | 0.4329 | 0.5682 | 0 |
| 2022-10-02 → 2023-01-02 | 552 | 0.6876 | 0.6341 | 0.7308 | 0 |
| 2023-01-02 → 2023-04-02 | 540 | 0.6278 | 0.5751 | 0.6767 | 0 |
| 2023-04-02 → 2023-07-02 | 546 | 0.4281 | 0.3484 | 0.5043 | 0 |
| 2023-07-02 → 2023-10-02 | 552 | 0.6169 | 0.5522 | 0.6778 | 0 |
| 2023-10-02 → 2024-01-02 | 552 | 0.5688 | 0.508 | 0.6384 | 0 |
| 2024-01-02 → 2024-04-02 | 546 | 0.7 | 0.6524 | 0.742 | 0 |
| 2024-04-02 → 2024-07-02 | 546 | 0.649 | 0.5864 | 0.7013 | 0 |
| 2024-07-02 → 2024-10-02 | 552 | 0.5242 | 0.4655 | 0.5801 | 0 |
| 2024-10-02 → 2025-01-02 | 552 | 0.6396 | 0.5809 | 0.686 | 0 |
| 2025-01-02 → 2025-04-02 | 540 | 0.723 | 0.6787 | 0.7682 | 0 |
| 2025-04-02 → 2025-07-02 | 546 | 0.6031 | 0.5444 | 0.6535 | 0 |
| 2025-07-02 → 2025-10-02 | 552 | 0.5902 | 0.5261 | 0.6513 | 0 |
| 2025-10-02 → 2026-01-02 | 552 | 0.6289 | 0.566 | 0.6858 | 0 |
| 2026-01-02 → 2026-04-02 | 540 | 0.6356 | 0.5733 | 0.6825 | 0 |
1d horizon
| window | n | IC | ci_low | ci_high | p_value |
|---|---|---|---|---|---|
| 2021-01-02 → 2021-04-02 | 90 | 0.6714 | 0.5075 | 0.7731 | 0 |
| 2021-04-02 → 2021-07-02 | 91 | 0.7047 | 0.5606 | 0.8114 | 0 |
| 2021-07-02 → 2021-10-02 | 92 | 0.4895 | 0.3237 | 0.6657 | 0 |
| 2021-10-02 → 2022-01-02 | 92 | 0.2787 | 0.093 | 0.4765 | 0.0071 |
| 2022-01-02 → 2022-04-02 | 90 | 0.4782 | 0.3399 | 0.6282 | 0 |
| 2022-04-02 → 2022-07-02 | 91 | 0.6108 | 0.4097 | 0.7412 | 0 |
| 2022-07-02 → 2022-10-02 | 92 | 0.3492 | 0.1478 | 0.5361 | 0.0006 |
| 2022-10-02 → 2023-01-02 | 92 | 0.5766 | 0.4295 | 0.7048 | 0 |
| 2023-01-02 → 2023-04-02 | 90 | 0.6169 | 0.4649 | 0.7321 | 0 |
| 2023-04-02 → 2023-07-02 | 91 | 0.2575 | 0.0512 | 0.441 | 0.0137 |
| 2023-07-02 → 2023-10-02 | 92 | 0.3808 | 0.1437 | 0.5473 | 0.0002 |
| 2023-10-02 → 2024-01-02 | 92 | 0.3651 | 0.1538 | 0.5281 | 0.0003 |
| 2024-01-02 → 2024-04-02 | 91 | 0.6035 | 0.4335 | 0.7133 | 0 |
| 2024-04-02 → 2024-07-02 | 91 | 0.553 | 0.4007 | 0.6948 | 0 |
| 2024-07-02 → 2024-10-02 | 92 | 0.3833 | 0.1763 | 0.5163 | 0.0002 |
| 2024-10-02 → 2025-01-02 | 92 | 0.4654 | 0.2786 | 0.634 | 0 |
| 2025-01-02 → 2025-04-02 | 90 | 0.5396 | 0.3479 | 0.673 | 0 |
| 2025-04-02 → 2025-07-02 | 91 | 0.5514 | 0.3885 | 0.6966 | 0 |
| 2025-07-02 → 2025-10-02 | 92 | 0.3599 | 0.1497 | 0.5528 | 0.0004 |
| 2025-10-02 → 2026-01-02 | 92 | 0.5039 | 0.3326 | 0.6519 | 0 |
| 2026-01-02 → 2026-04-02 | 90 | 0.6805 | 0.5437 | 0.8007 | 0 |