Cross-asset vol-clustering: BTC vs ETH vs SOL
PromotedHypothesis
Vol-clustering is a crypto-market phenomenon, not a BTC-specific quirk. ETH and SOL should show similar walk-forward IC between trailing and forward realised volatility at 1h / 4h / 1d horizons.
Verdict
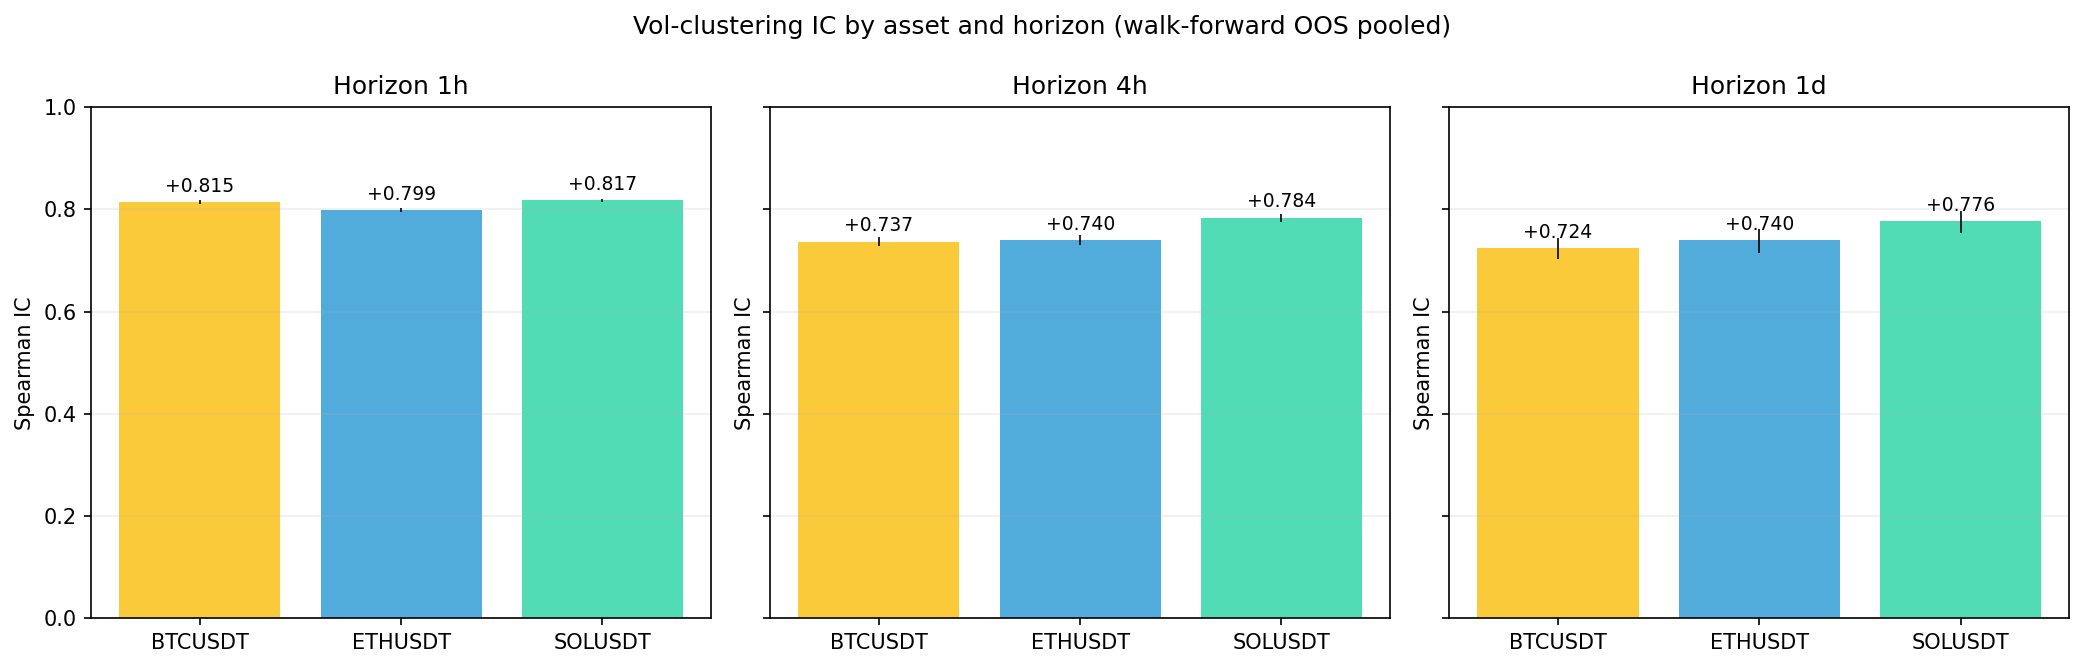
**CONFIRMED** — vol-clustering is a robust crypto-market feature. 4h IC: BTC +0.737, ETH +0.740, SOL +0.784. Spread across assets: 0.047. ETH/SOL forecasters are worth training if we ever trade them.
horizons
['1h', '4h', '1d']
BTC_4h_IC
+0.7366
ETH_4h_IC
+0.7401
SOL_4h_IC
+0.7837
spread_4h
+0.0470
Cross-asset vol-clustering: BTC vs ETH vs SOL
2026-05-17 · status: promoted · 43.0s
Hypothesis: Vol-clustering is a crypto-market phenomenon, not a BTC-specific quirk. ETH and SOL should show similar walk-forward IC between trailing and forward realised volatility at 1h / 4h / 1d horizons.
Verdict: CONFIRMED — vol-clustering is a robust crypto-market feature. 4h IC: BTC +0.737, ETH +0.740, SOL +0.784. Spread across assets: 0.047. ETH/SOL forecasters are worth training if we ever trade them.
Key metrics
| metric | value |
|---|---|
| BTC_4h_IC | +0.7366 |
| ETH_4h_IC | +0.7401 |
| SOL_4h_IC | +0.7837 |
| spread_4h | +0.0470 |
| horizons | ['1h', '4h', '1d'] |
Approach
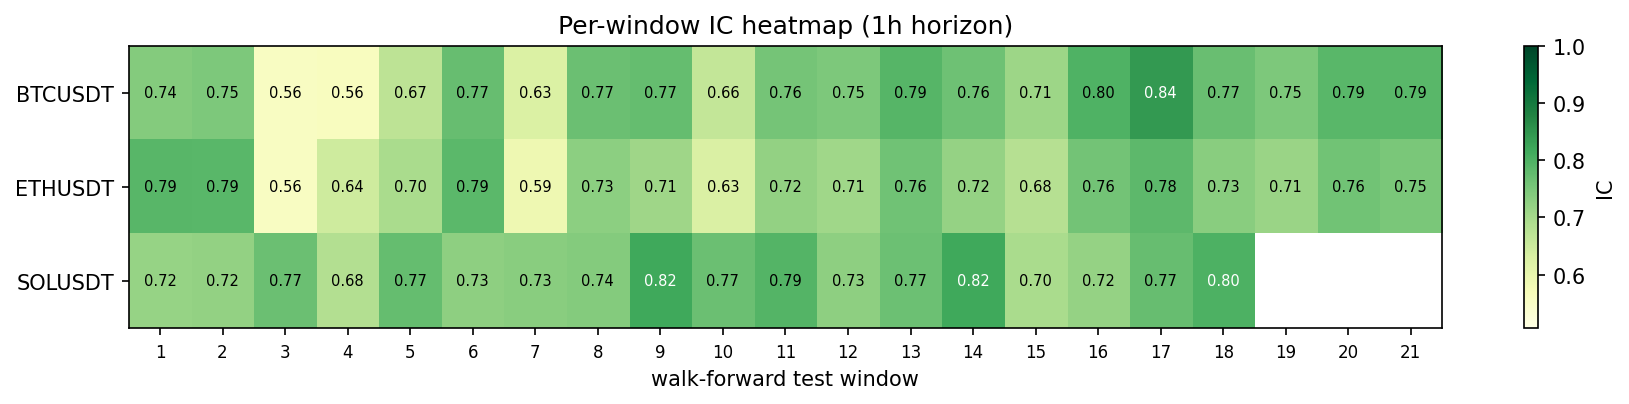
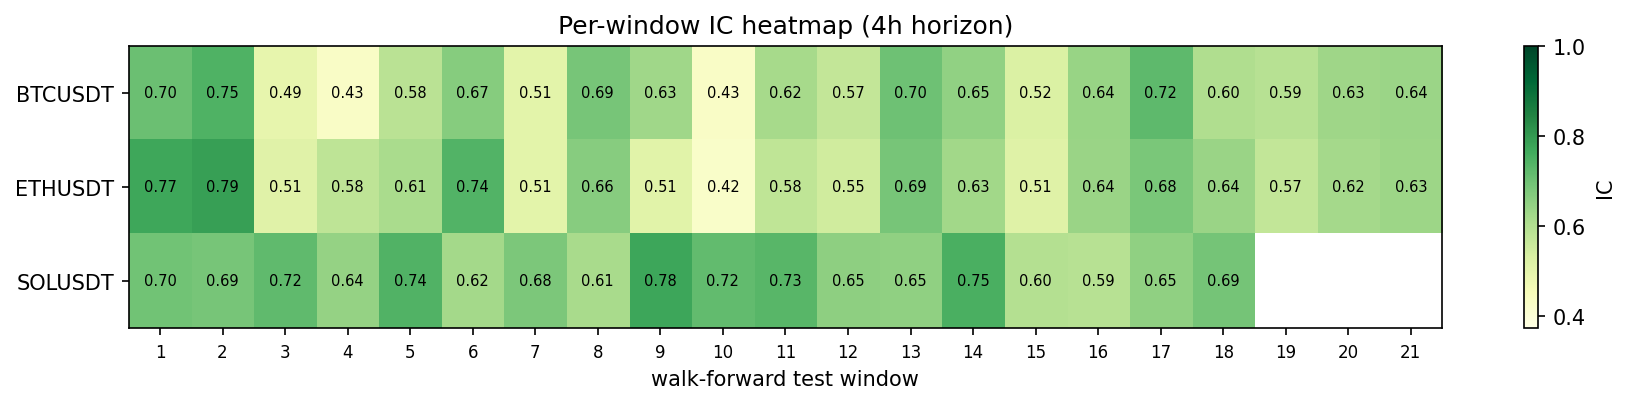
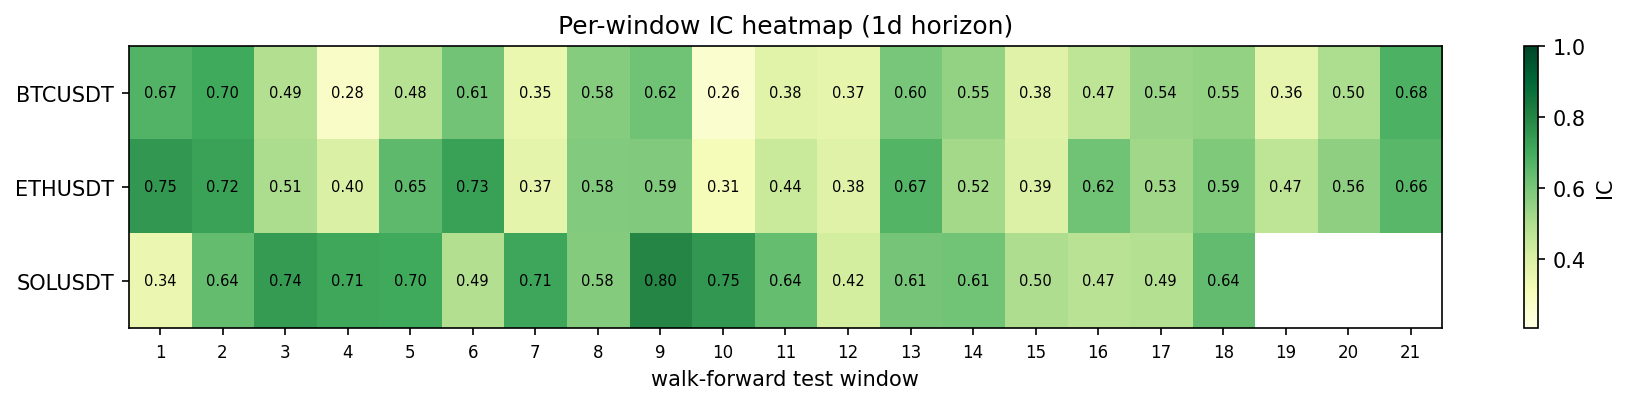
Repeat Exp 1 (vol-clustering) on BTC, ETH, SOL — same methodology: trailing rv_h vs forward rv_h, sampled every h bars to avoid overlap, Spearman IC computed per walk-forward window (12mo train / 3mo test, 1-day embargo).
Pooled results per asset × horizon
| symbol | horizon | pooled_IC | pooled_CI_low | pooled_CI_high | pooled_n | windows_min | windows_max | windows_mean | stable_pos | total_windows |
|---|---|---|---|---|---|---|---|---|---|---|
| BTCUSDT | 1h | 0.8146 | 0.8112 | 0.8186 | 55,822 | 0.5571 | 0.8433 | 0.732 | 21 | 21 |
| BTCUSDT | 4h | 0.7366 | 0.7286 | 0.7463 | 13,954 | 0.4281 | 0.7455 | 0.6073 | 18 | 21 |
| BTCUSDT | 1d | 0.7239 | 0.7019 | 0.7437 | 2,324 | 0.2575 | 0.7047 | 0.4962 | 11 | 21 |
| ETHUSDT | 1h | 0.7989 | 0.7952 | 0.8027 | 55,870 | 0.5571 | 0.79 | 0.7144 | 21 | 21 |
| ETHUSDT | 4h | 0.7401 | 0.731 | 0.7489 | 13,966 | 0.4243 | 0.7896 | 0.6113 | 20 | 21 |
| ETHUSDT | 1d | 0.7398 | 0.7154 | 0.7608 | 2,326 | 0.3122 | 0.7493 | 0.5442 | 14 | 21 |
| SOLUSDT | 1h | 0.8175 | 0.8143 | 0.8208 | 49,575 | 0.684 | 0.8188 | 0.7524 | 18 | 18 |
| SOLUSDT | 4h | 0.7837 | 0.7753 | 0.7911 | 12,393 | 0.5902 | 0.775 | 0.679 | 18 | 18 |
| SOLUSDT | 1d | 0.7763 | 0.7544 | 0.7961 | 2,064 | 0.3437 | 0.7982 | 0.6027 | 12 | 18 |