Vol × Time interaction: hidden cells in (regime × hour × dow)
InconclusiveVol × Time interaction: hidden cells in (regime × hour × dow)
2026-05-17 · status: inconclusive · 1.5s
Hypothesis: Certain (vol_regime × hour) or (vol_regime × day-of-week) cells produce systematically non-zero forward 4h returns walk-forward, even though the aggregate hour/dow effects were near-zero. Cells with within-cell sample independence (24h apart) give clean t-stats.
Verdict: MARGINAL — strongest cell vol_Q3 × hour=07 shows mean +18.6 bps, t +1.73, stability 75% — close to the bar but not over. Tighter horizons (1h/15m) or finer regime bins might surface a clearer effect, but for now no cell meets the production gate.
Key metrics
| metric | value |
|---|---|
| n_robust_cells | 0 |
| n_robust_hour | 0 |
| n_robust_dow | 0 |
| strongest_axis | hour |
| strongest_regime | 2 |
| strongest_bucket | 07 |
| strongest_mean_bps | +18.6480 |
| strongest_t_stat | +1.7282 |
| strongest_stability | +0.7500 |
| n_windows | 21 |
Background — what we've already ruled out
Calendar/time factors we've previously tested in isolation and found weak or dead:
| Hypothesis | Verdict | Source |
|---|---|---|
| UTC hour effect (aggregate) | inconclusive — only hour 22 robust, +3.26 bps | time_of_day |
| Day-of-week effect (aggregate) | inconclusive — overview t-stats overlap-inflated | time_of_day |
| Volume-shock direction | dropped — rally vs decline both ≈ +3 bps | volume_shock |
| Funding extreme reversal | inconclusive — Q0 actually negative | funding_extreme |
| Direction prediction (33 features) | dropped — IC +0.015, spread 5 bps | direction_baseline |
| Direction + 14 macro features | dropped — spread fell to 3.6 bps | direction_with_macro |
This experiment: cross the two surviving findings (vol-clustering & weak time effects) into a 2D grid. Maybe opposing effects in different vol regimes cancel each other in aggregate analysis.
Approach
For each walk-forward window: vol-regime terciles are learned on the training segment (cuts based on trailing rv_240m), then applied to the test segment. Each test-set hourly observation belongs to one of 3 vol regimes and exactly one hour of day / day of week. Within a single (regime × hour) cell, observations are spaced 24h apart → independent samples → t-stats are honest.
Cells: 3 × 24 = 72 (vol × hour), 3 × 7 = 21 (vol × dow), 3 × 24 × 7 = 504 (full 3D, only checked if 2D passes).
Promote gate — at least ONE cell with: - pooled |mean fwd-4h| > 20 bps - |t-stat| > 2.0 - same sign in ≥ 70% of walk-forward windows that have ≥ 10 obs in the cell
1. Vol-regime × Hour-of-day
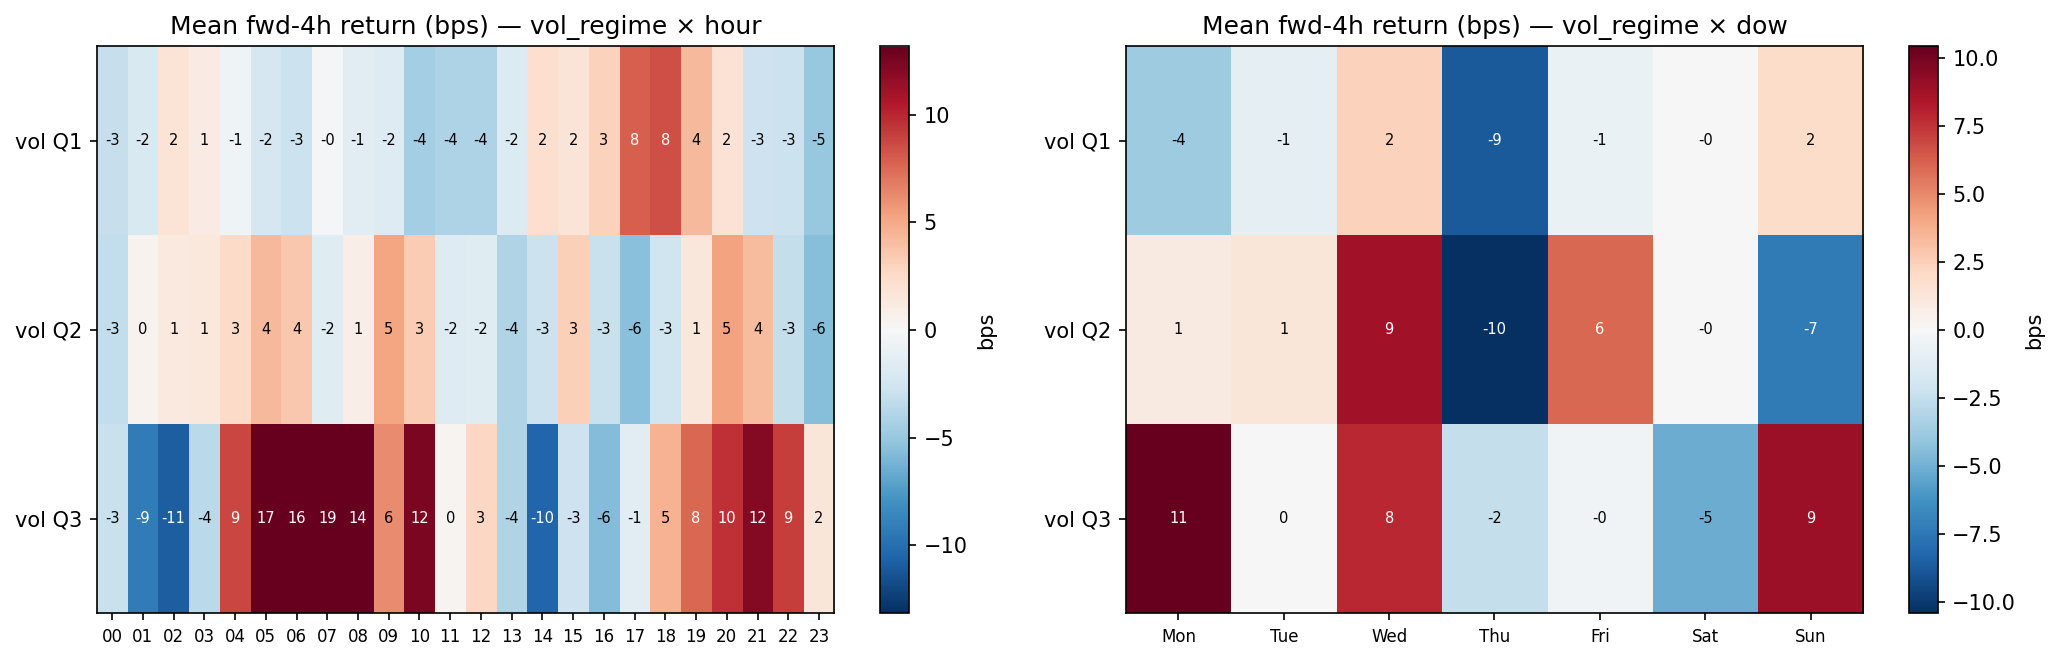
Mean fwd-4h return (bps) per cell
| 00 | 01 | 02 | 03 | 04 | 05 | 06 | 07 | 08 | 09 | 10 | 11 | 12 | 13 | 14 | 15 | 16 | 17 | 18 | 19 | 20 | 21 | 22 | 23 | |
|---|---|---|---|---|---|---|---|---|---|---|---|---|---|---|---|---|---|---|---|---|---|---|---|---|
| vol_Q1 | -3.1 | -2 | 1.8 | 1.1 | -0.5 | -2.2 | -2.8 | -0.2 | -1.4 | -1.7 | -4.5 | -4 | -4.1 | -1.8 | 2.2 | 1.7 | 3 | 7.9 | 8.4 | 4.3 | 1.9 | -2.7 | -2.8 | -5 |
| vol_Q2 | -3.2 | 0.5 | 1.3 | 1.4 | 2.6 | 4.3 | 3.6 | -1.6 | 0.9 | 5.2 | 3.3 | -1.7 | -1.6 | -3.9 | -2.8 | 3.2 | -2.9 | -5.5 | -2.7 | 1.5 | 5.3 | 4.2 | -3.2 | -5.6 |
| vol_Q3 | -3 | -9.2 | -10.8 | -3.6 | 8.8 | 16.8 | 15.7 | 18.6 | 14.1 | 6.3 | 12.4 | 0.3 | 2.7 | -4 | -10.5 | -2.8 | -5.8 | -1.4 | 4.6 | 7.6 | 9.7 | 12.1 | 9.1 | 1.6 |
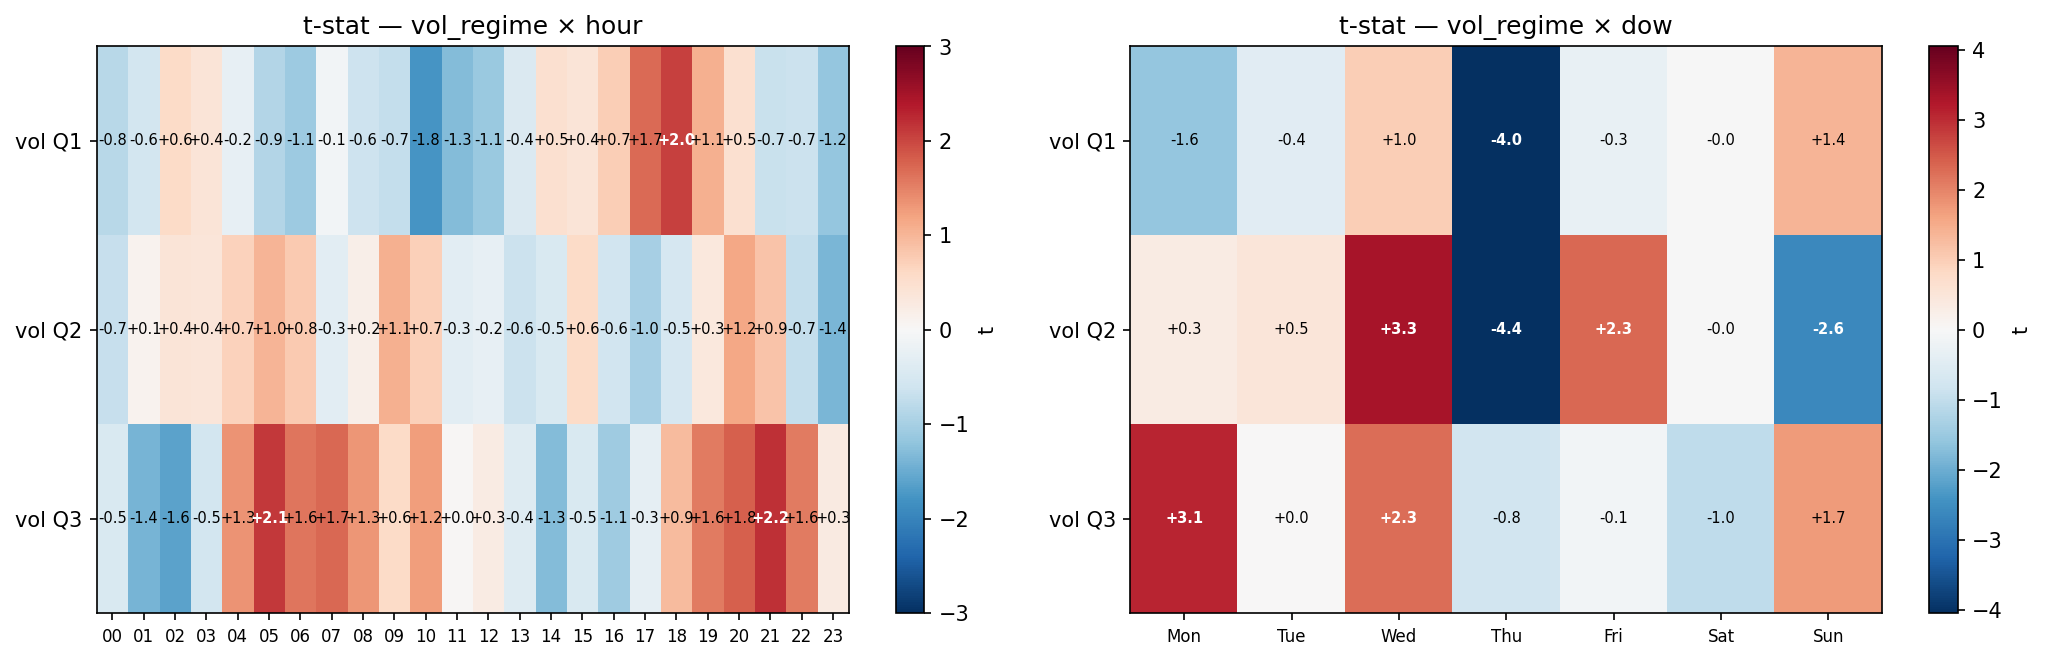
t-stat per cell (|t| > 2 ≈ unlikely zero)
| 00 | 01 | 02 | 03 | 04 | 05 | 06 | 07 | 08 | 09 | 10 | 11 | 12 | 13 | 14 | 15 | 16 | 17 | 18 | 19 | 20 | 21 | 22 | 23 | |
|---|---|---|---|---|---|---|---|---|---|---|---|---|---|---|---|---|---|---|---|---|---|---|---|---|
| vol_Q1 | -0.82 | -0.55 | 0.58 | 0.39 | -0.24 | -0.87 | -1.1 | -0.08 | -0.61 | -0.72 | -1.77 | -1.29 | -1.11 | -0.45 | 0.49 | 0.4 | 0.73 | 1.7 | 2.04 | 1.06 | 0.48 | -0.66 | -0.65 | -1.16 |
| vol_Q2 | -0.68 | 0.12 | 0.38 | 0.36 | 0.7 | 1.02 | 0.78 | -0.31 | 0.17 | 1.07 | 0.71 | -0.32 | -0.24 | -0.65 | -0.46 | 0.58 | -0.56 | -1 | -0.5 | 0.32 | 1.15 | 0.85 | -0.72 | -1.37 |
| vol_Q3 | -0.46 | -1.4 | -1.62 | -0.55 | 1.35 | 2.12 | 1.61 | 1.73 | 1.32 | 0.58 | 1.25 | 0.04 | 0.25 | -0.39 | -1.3 | -0.46 | -1.07 | -0.28 | 0.95 | 1.56 | 1.8 | 2.19 | 1.57 | 0.28 |
Stability (fraction of WF windows agreeing with overall sign)
| 00 | 01 | 02 | 03 | 04 | 05 | 06 | 07 | 08 | 09 | 10 | 11 | 12 | 13 | 14 | 15 | 16 | 17 | 18 | 19 | 20 | 21 | 22 | 23 | |
|---|---|---|---|---|---|---|---|---|---|---|---|---|---|---|---|---|---|---|---|---|---|---|---|---|
| vol_Q1 | 0.44 | 0.59 | 0.65 | 0.59 | 0.5 | 0.63 | 0.53 | 0.63 | 0.53 | 0.47 | 0.42 | 0.61 | 0.56 | 0.39 | 0.67 | 0.56 | 0.5 | 0.79 | 0.69 | 0.65 | 0.53 | 0.53 | 0.53 | 0.53 |
| vol_Q2 | 0.55 | 0.47 | 0.45 | 0.55 | 0.5 | 0.58 | 0.58 | 0.5 | 0.44 | 0.63 | 0.5 | 0.67 | 0.56 | 0.45 | 0.6 | 0.6 | 0.58 | 0.61 | 0.47 | 0.58 | 0.53 | 0.6 | 0.55 | 0.55 |
| vol_Q3 | 0.61 | 0.47 | 0.65 | 0.56 | 0.67 | 0.79 | 0.75 | 0.75 | 0.92 | 0.58 | 0.67 | 0.64 | 0.57 | 0.5 | 0.63 | 0.57 | 0.57 | 0.57 | 0.57 | 0.6 | 0.5 | 0.75 | 0.65 | 0.47 |
2. Vol-regime × Day-of-week
Mean fwd-4h return (bps) per cell
| Mon | Tue | Wed | Thu | Fri | Sat | Sun | |
|---|---|---|---|---|---|---|---|
| vol_Q1 | -3.7 | -1 | 2.4 | -8.8 | -0.7 | -0 | 1.9 |
| vol_Q2 | 0.9 | 1.3 | 8.7 | -10.4 | 6 | -0.1 | -7.4 |
| vol_Q3 | 11.2 | 0 | 7.9 | -2.5 | -0.4 | -5.1 | 8.9 |
t-stat per cell
| Mon | Tue | Wed | Thu | Fri | Sat | Sun | |
|---|---|---|---|---|---|---|---|
| vol_Q1 | -1.56 | -0.45 | 1.01 | -4.05 | -0.29 | -0.02 | 1.39 |
| vol_Q2 | 0.34 | 0.48 | 3.33 | -4.37 | 2.31 | -0.02 | -2.6 |
| vol_Q3 | 3.08 | 0 | 2.26 | -0.76 | -0.13 | -1.04 | 1.72 |
Stability
| Mon | Tue | Wed | Thu | Fri | Sat | Sun | |
|---|---|---|---|---|---|---|---|
| vol_Q1 | 0.68 | 0.61 | 0.42 | 0.71 | 0.53 | 0.45 | 0.6 |
| vol_Q2 | 0.43 | 0.57 | 0.6 | 0.76 | 0.57 | 0.43 | 0.48 |
| vol_Q3 | 0.67 | 0.48 | 0.62 | 0.62 | 0.48 | 0.71 | 0.53 |
3. Robust cells (passing all gates)
No cells pass all three gates.