Stablecoin-Drift — 7d Supply Δ as BTC Directional Signal
InconclusiveStablecoin-Drift — 7d Supply Δ as BTC Directional Signal
2026-05-19 · status: inconclusive · 3.9s
Hypothesis: Δ in total stablecoin USD market cap (USDT+USDC+others) over the past 7 days predicts BTC forward 1d return at IC ≥ 0.05 walk-forward; top-quintile supply expansion days are followed by ≥40 bps higher fwd-1d return than baseline.
Verdict: WEAK — IC +0.0376, spread +25 bps. Daily-resolution stablecoin supply doesn't carry strong forward-return information at the 1d horizon. The lit's '1-30d delay' may be too slow to capture as a tradable edge.
Key metrics
| metric | value |
|---|---|
| pooled_IC_1d | +0.0376 |
| pooled_CI_1d | [-0.0028, +0.0739] |
| pooled_IC_4h | -0.0250 |
| pooled_n_1d | 2,327 |
| windows_pos_1d | 12 |
| n_windows_1d | 21 |
| stability_1d | +0.5714 |
| q5_mean_bps | +25.2963 |
| q1_mean_bps | -0.0693 |
| q5_minus_q1_bps | +25.3657 |
Approach
Daily total stablecoin USD market cap (DefiLlama aggregate) → 7d log-Δ as causal feature. Tested against BTC fwd-1d log return (primary) and fwd-4h log return (secondary). Walk-forward 12mo train / 3mo test, 1-day embargo. Quintile analysis on daily, sampled-every-24h for 4h panel.
Pooled OOS IC
-
1d horizon: IC =
+0.0376(n=2,327, 95% CI [-0.0028, +0.0739], p=0.0696) -
4h horizon: IC =
-0.0250(n=2,320, 95% CI [-0.0699, +0.0190], p=0.229)
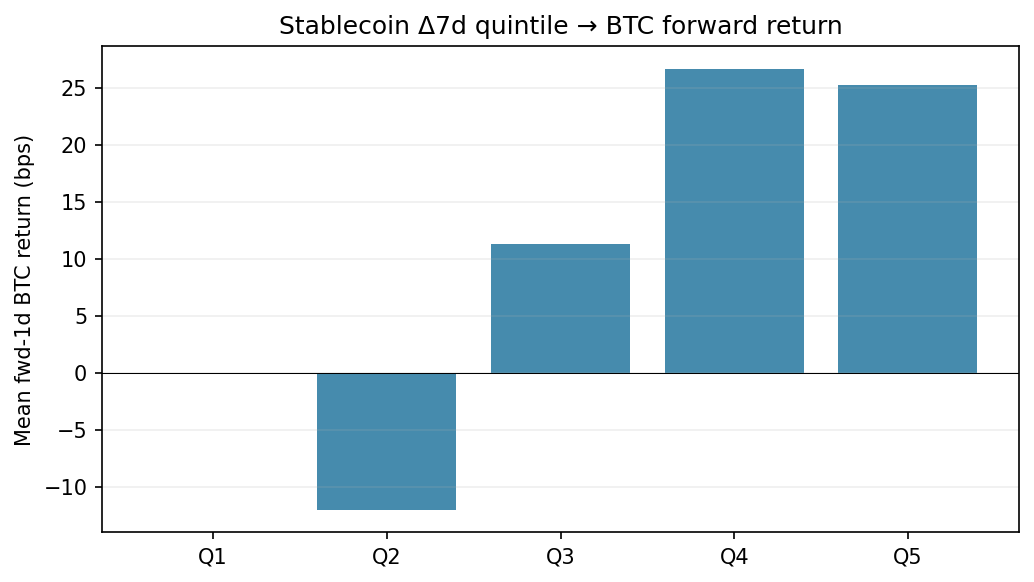
Quintile table — fwd-1d BTC return by stablecoin Δ7d quintile
| quantile | count | mean_bps | std |
|---|---|---|---|
| 0 | 466 | -0.1 | 0.0300444 |
| 1 | 465 | -12 | 0.0247435 |
| 2 | 465 | 11.3 | 0.0356338 |
| 3 | 465 | 26.7 | 0.0333834 |
| 4 | 466 | 25.3 | 0.0371588 |
-
Q5 − Q1 spread:
+25.4bps -
Q5 mean:
+25.3bps -
Q1 mean:
-0.1bps
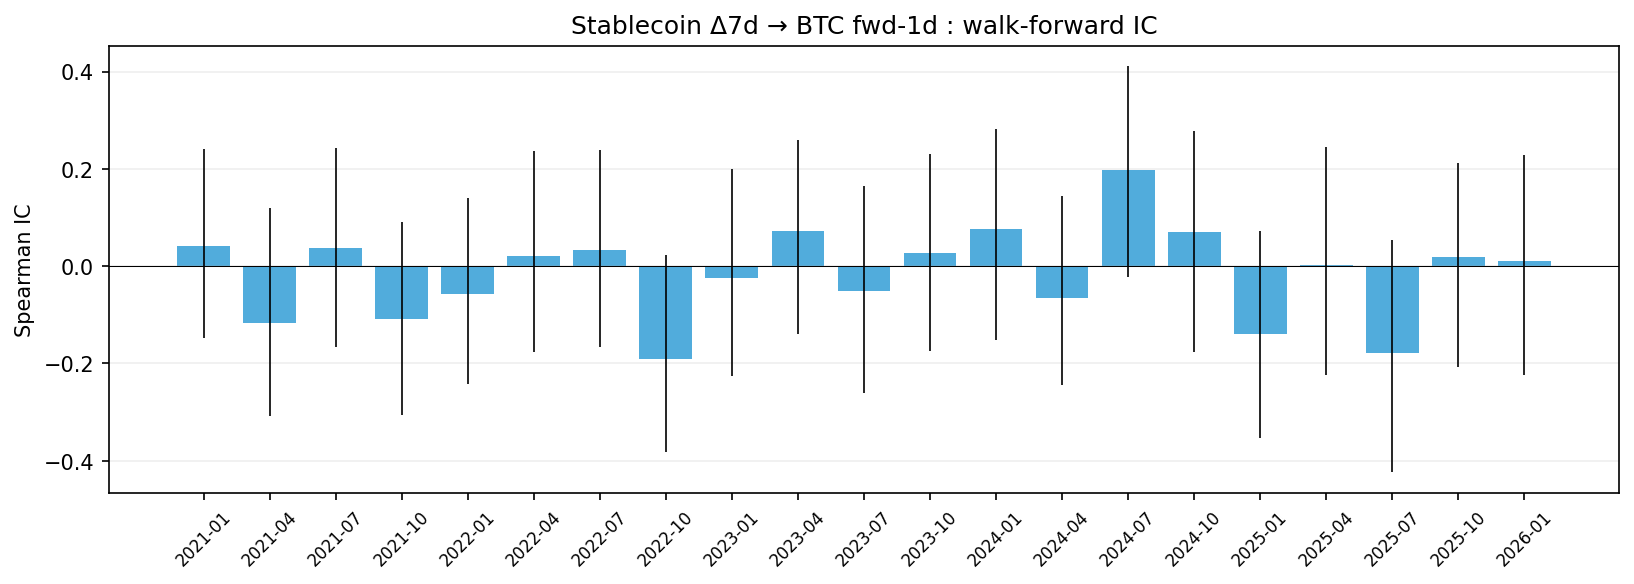
Per-window IC (1d horizon, 21 windows)
| window | n | IC | ci_low | ci_high | p_value |
|---|---|---|---|---|---|
| 2021-01-02 → 2021-04-02 | 90 | 0.0409 | -0.1468 | 0.2411 | 0.7017 |
| 2021-04-02 → 2021-07-02 | 91 | -0.1174 | -0.3077 | 0.1204 | 0.2676 |
| 2021-07-02 → 2021-10-02 | 92 | 0.0363 | -0.1655 | 0.2432 | 0.731 |
| 2021-10-02 → 2022-01-02 | 92 | -0.1089 | -0.3061 | 0.0917 | 0.3014 |
| 2022-01-02 → 2022-04-02 | 90 | -0.0582 | -0.2428 | 0.1408 | 0.586 |
| 2022-04-02 → 2022-07-02 | 91 | 0.0217 | -0.1763 | 0.2365 | 0.8383 |
| 2022-07-02 → 2022-10-02 | 92 | 0.0324 | -0.1661 | 0.2382 | 0.7591 |
| 2022-10-02 → 2023-01-02 | 92 | -0.1918 | -0.3828 | 0.0237 | 0.0671 |
| 2023-01-02 → 2023-04-02 | 90 | -0.0241 | -0.2269 | 0.1991 | 0.8217 |
| 2023-04-02 → 2023-07-02 | 91 | 0.0727 | -0.1399 | 0.2595 | 0.4936 |
| 2023-07-02 → 2023-10-02 | 92 | -0.0507 | -0.2609 | 0.1655 | 0.6314 |
| 2023-10-02 → 2024-01-02 | 92 | 0.0262 | -0.1753 | 0.2311 | 0.804 |
| 2024-01-02 → 2024-04-02 | 91 | 0.0764 | -0.1511 | 0.2815 | 0.4716 |
| 2024-04-02 → 2024-07-02 | 91 | -0.065 | -0.2435 | 0.1445 | 0.5407 |
| 2024-07-02 → 2024-10-02 | 92 | 0.1975 | -0.0233 | 0.4116 | 0.0591 |
| 2024-10-02 → 2025-01-02 | 92 | 0.0701 | -0.1765 | 0.2771 | 0.5067 |
| 2025-01-02 → 2025-04-02 | 90 | -0.1396 | -0.3542 | 0.0724 | 0.1894 |
| 2025-04-02 → 2025-07-02 | 91 | 0.0021 | -0.2234 | 0.2439 | 0.9841 |
| 2025-07-02 → 2025-10-02 | 92 | -0.1784 | -0.4239 | 0.0542 | 0.0888 |
| 2025-10-02 → 2026-01-02 | 92 | 0.0184 | -0.207 | 0.2131 | 0.862 |
| 2026-01-02 → 2026-04-02 | 90 | 0.0103 | -0.2245 | 0.2278 | 0.9234 |
Per-window IC (4h horizon, 21 windows)
| window | n | IC | ci_low | ci_high |
|---|---|---|---|---|
| 2021-01-09 → 2021-04-09 | 90 | -0.0021 | -0.233 | 0.216 |
| 2021-04-09 → 2021-07-09 | 91 | 0.0451 | -0.1792 | 0.2541 |
| 2021-07-09 → 2021-10-09 | 92 | 0.2137 | 0.0203 | 0.4114 |
| 2021-10-09 → 2022-01-09 | 92 | -0.1659 | -0.3593 | 0.0465 |
| 2022-01-09 → 2022-04-09 | 90 | -0.1413 | -0.3425 | 0.0736 |
| 2022-04-09 → 2022-07-09 | 91 | 0.1344 | -0.0626 | 0.3622 |
| 2022-07-09 → 2022-10-09 | 92 | -0.0055 | -0.2114 | 0.222 |
| 2022-10-09 → 2023-01-09 | 92 | -0.1996 | -0.4167 | 0.0334 |
| 2023-01-09 → 2023-04-09 | 90 | 0.0593 | -0.1407 | 0.278 |
| 2023-04-09 → 2023-07-09 | 91 | 0.0138 | -0.1922 | 0.224 |
| 2023-07-09 → 2023-10-09 | 92 | 0.0117 | -0.1888 | 0.2304 |
| 2023-10-09 → 2024-01-09 | 92 | 0.0746 | -0.1542 | 0.2534 |
| 2024-01-09 → 2024-04-09 | 91 | 0.0324 | -0.1738 | 0.2432 |
| 2024-04-09 → 2024-07-09 | 91 | -0.0519 | -0.2578 | 0.1894 |
| 2024-07-09 → 2024-10-09 | 92 | -0.0138 | -0.2273 | 0.2095 |
| 2024-10-09 → 2025-01-09 | 92 | 0.0967 | -0.0887 | 0.298 |
| 2025-01-09 → 2025-04-09 | 90 | 0.0524 | -0.1756 | 0.2618 |
| 2025-04-09 → 2025-07-09 | 91 | 0.034 | -0.1788 | 0.2356 |
| 2025-07-09 → 2025-10-09 | 92 | 0.0103 | -0.2134 | 0.2409 |
| 2025-10-09 → 2026-01-09 | 92 | -0.1055 | -0.3154 | 0.1366 |
| 2026-01-09 → 2026-04-09 | 90 | -0.0535 | -0.2904 | 0.1739 |