Time-of-day conditional return
InconclusiveTime-of-day conditional return
2026-05-17 · status: inconclusive · 0.9s
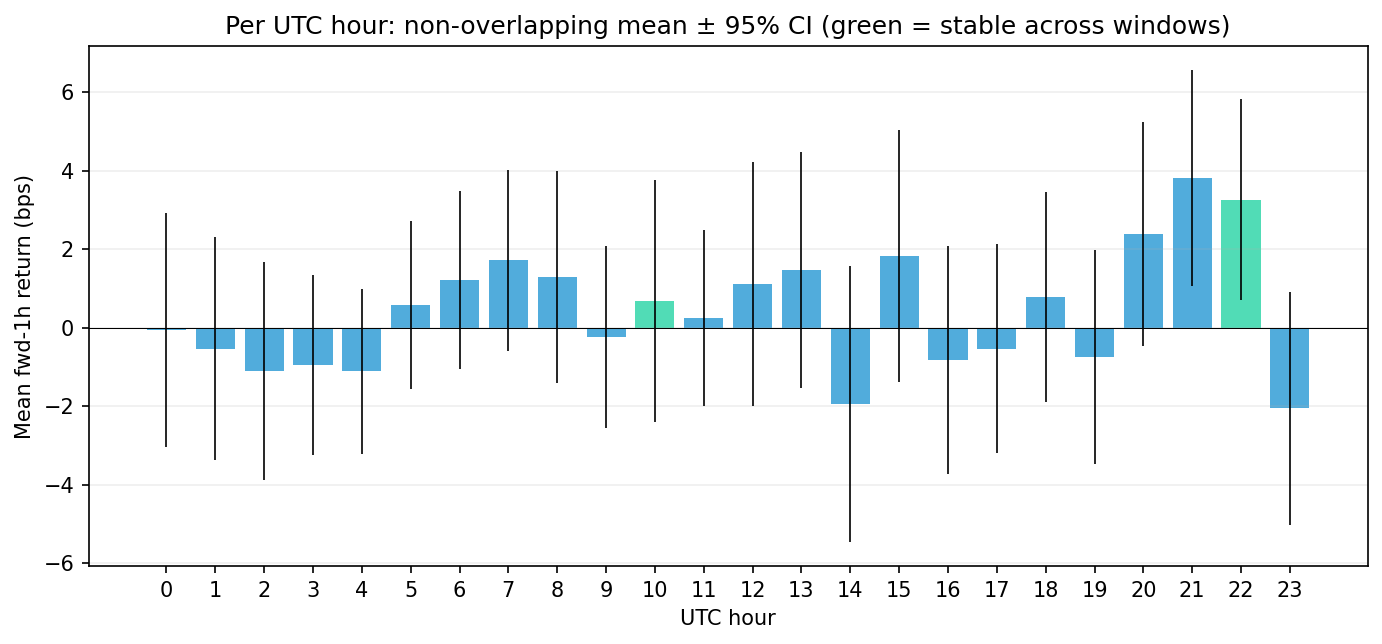
Hypothesis: Specific UTC hours produce systematically non-zero forward-1h returns that remain directionally stable across walk-forward windows when sampled non-overlapping (one observation per hour).
Verdict: WEAK — only 1 hour(s) pass both stability + significance. Best: hour 22 +3.26 bps. Effect exists but is too thin and not broad enough to anchor a strategy on alone.
Key metrics
| metric | value |
|---|---|
| robust_hours | 1 |
| best_hour_utc | 22 |
| best_mean_bps | +3.2611 |
| best_stability | +0.7143 |
| total_windows | 21 |
Approach
We aggregate the 1m data to hourly non-overlapping bars and compute the log return from each hourly close to the next. Each UTC hour bucket therefore contains ≈ 2,300 independent observations (one per day, × 6.3 years). Walk-forward windows: 12mo train / 3mo test, 1-day embargo.
Walk-forward windows: 21
Full-sample per UTC hour (non-overlapping samples)
| hour | mean_bps | se_bps | count | t_stat |
|---|---|---|---|---|
| 0 | -0.07 | 1.52 | 2310 | -0.04 |
| 1 | -0.54 | 1.45 | 2310 | -0.37 |
| 2 | -1.1 | 1.42 | 2310 | -0.77 |
| 3 | -0.95 | 1.17 | 2310 | -0.81 |
| 4 | -1.11 | 1.08 | 2310 | -1.04 |
| 5 | 0.57 | 1.09 | 2310 | 0.52 |
| 6 | 1.22 | 1.15 | 2310 | 1.06 |
| 7 | 1.71 | 1.18 | 2310 | 1.45 |
| 8 | 1.3 | 1.38 | 2310 | 0.94 |
| 9 | -0.24 | 1.18 | 2310 | -0.21 |
| 10 | 0.68 | 1.57 | 2310 | 0.43 |
| 11 | 0.25 | 1.14 | 2310 | 0.22 |
| 12 | 1.11 | 1.59 | 2310 | 0.7 |
| 13 | 1.46 | 1.53 | 2310 | 0.95 |
| 14 | -1.95 | 1.8 | 2310 | -1.08 |
| 15 | 1.82 | 1.64 | 2310 | 1.11 |
| 16 | -0.83 | 1.48 | 2310 | -0.56 |
| 17 | -0.54 | 1.36 | 2310 | -0.4 |
| 18 | 0.77 | 1.36 | 2310 | 0.57 |
| 19 | -0.75 | 1.4 | 2310 | -0.53 |
| 20 | 2.39 | 1.46 | 2310 | 1.64 |
| 21 | 3.81 | 1.41 | 2310 | 2.71 |
| 22 | 3.26 | 1.31 | 2310 | 2.49 |
| 23 | -2.06 | 1.51 | 2310 | -1.36 |
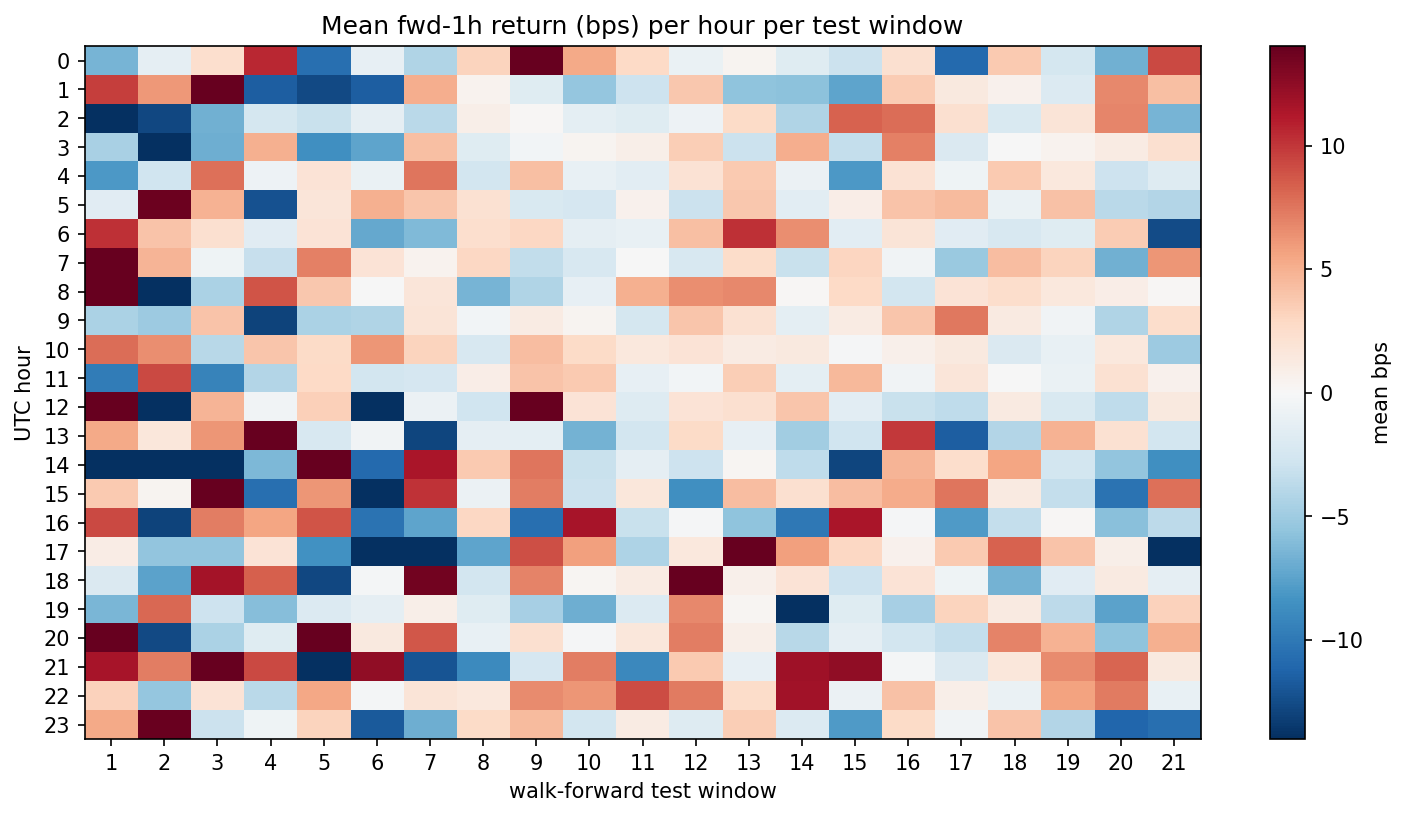
Walk-forward stability per hour
Each cell is the mean fwd-1h return (bps) for that UTC hour within that walk-forward test window. stability = fraction of windows whose mean has the same sign as the full-sample mean.
| hour | 1 | 2 | 3 | 4 | 5 | 6 | 7 | 8 | 9 | 10 | 11 | 12 | 13 | 14 | 15 | 16 | 17 | 18 | 19 | 20 | 21 |
|---|---|---|---|---|---|---|---|---|---|---|---|---|---|---|---|---|---|---|---|---|---|
| 0 | -6.48 | -1.26 | 2.36 | 10.6 | -10.6 | -1.11 | -4.17 | 3.1 | 15.32 | 5.28 | 2.75 | -0.94 | 0.4 | -1.69 | -3.05 | 2.3 | -10.92 | 3.64 | -2.51 | -6.76 | 9.31 |
| 1 | 9.66 | 6.03 | 14.27 | -11.51 | -12.69 | -11.61 | 5.07 | 0.54 | -1.66 | -5.39 | -2.94 | 3.76 | -5.61 | -5.8 | -7.44 | 3.58 | 1.38 | 0.63 | -1.95 | 6.77 | 4.17 |
| 2 | -18.49 | -12.78 | -6.69 | -2.51 | -3.07 | -1.23 | -3.79 | 0.83 | 0.17 | -1.4 | -1.75 | -0.72 | 2.69 | -4.17 | 8.26 | 7.82 | 2.24 | -2.19 | 1.84 | 6.84 | -6.56 |
| 3 | -4.57 | -16.87 | -6.9 | 4.93 | -8.66 | -7.36 | 4.25 | -1.67 | -0.41 | 0.35 | 0.83 | 3.47 | -2.96 | 5.07 | -3.36 | 7.09 | -1.99 | -0.02 | 0.49 | 1.1 | 2.3 |
| 4 | -8.07 | -2.81 | 7.69 | -0.7 | 1.94 | -0.97 | 7.48 | -2.6 | 4.24 | -1.09 | -1.43 | 1.97 | 3.67 | -0.87 | -8.08 | 2 | -0.56 | 3.64 | 1.43 | -2.9 | -1.84 |
| 5 | -1.58 | 13.72 | 4.93 | -12.26 | 1.74 | 4.98 | 3.84 | 2.1 | -2.18 | -2.39 | 0.56 | -3.07 | 3.81 | -1.46 | 0.9 | 4.05 | 4.47 | -0.94 | 4.11 | -3.74 | -4.13 |
| 6 | 10.2 | 4.04 | 2.26 | -1.6 | 1.87 | -7.15 | -6.21 | 2.32 | 2.92 | -1.21 | -1.09 | 4.23 | 10.26 | 6.5 | -1.46 | 1.8 | -1.6 | -2.28 | -1.66 | 3.57 | -12.52 |
| 7 | 17.97 | 4.77 | -0.57 | -3.24 | 7.08 | 1.87 | 0.46 | 2.95 | -3.41 | -2.19 | -0.03 | -2.27 | 2.55 | -3.16 | 3 | -0.44 | -5.16 | 4.3 | 3.1 | -6.73 | 6.21 |
| 8 | 25.38 | -17.45 | -4.45 | 8.84 | 3.79 | -0.04 | 1.71 | -6.53 | -4.26 | -1.16 | 5.03 | 6.5 | 6.73 | 0.13 | 2.81 | -2.6 | 1.92 | 2.45 | 1.47 | 0.92 | 0.13 |
| 9 | -4.41 | -5.09 | 4.02 | -12.98 | -4.47 | -4.23 | 1.81 | -0.34 | 1.18 | 0.44 | -2.42 | 3.94 | 2.12 | -1.34 | 1.18 | 3.89 | 7.44 | 1.29 | -0.49 | -4.19 | 2.48 |
| 10 | 7.78 | 6.51 | -3.9 | 3.9 | 2.73 | 6.15 | 3.08 | -2.27 | 4.38 | 2.71 | 1.46 | 1.93 | 1.2 | 1.42 | -0.18 | 0.74 | 1.37 | -2.03 | -1.08 | 1.52 | -5.13 |
| 11 | -9.75 | 9.23 | -9.41 | -4.06 | 2.77 | -2.57 | -2.36 | 0.9 | 4.03 | 3.68 | -1.18 | -0.37 | 3.46 | -1.33 | 4.58 | -0.48 | 1.65 | -0 | -0.95 | 2.13 | 0.56 |
| 12 | 32.04 | -17.65 | 4.8 | -0.5 | 3.33 | -17.63 | -0.86 | -2.74 | 14.29 | 1.91 | -1.76 | 1.92 | 2.22 | 3.94 | -1.49 | -3.17 | -3.6 | 1.31 | -2.17 | -3.6 | 1.32 |
| 13 | 5.3 | 1.57 | 6.17 | 24.07 | -2.25 | -0.47 | -12.89 | -1.22 | -1.34 | -6.59 | -2.55 | 2.67 | -1.17 | -4.88 | -2.81 | 9.87 | -11.58 | -4.07 | 4.87 | 2.11 | -2.62 |
| 14 | -17.36 | -19.17 | -14.03 | -6.35 | 14 | -10.86 | 11.47 | 3.67 | 7.46 | -3.15 | -1.24 | -2.89 | 0.33 | -3.55 | -12.91 | 4.81 | 2.47 | 5.56 | -2.56 | -5.52 | -8.6 |
| 15 | 3.71 | 0.36 | 16.83 | -10.59 | 6.23 | -17.67 | 10.18 | -0.81 | 7.23 | -3.04 | 1.53 | -8.65 | 4.28 | 2.3 | 4.28 | 5.23 | 7.45 | 1.25 | -3.39 | -10.36 | 7.73 |
| 16 | 9.21 | -12.97 | 7.23 | 5.58 | 8.86 | -10.33 | -7.37 | 2.92 | -10.57 | 11.61 | -3.13 | -0.14 | -5.63 | -10.01 | 11.41 | -0.18 | -7.92 | -3.31 | 0.22 | -5.85 | -3.72 |
| 17 | 1.06 | -5.58 | -5.5 | 1.93 | -8.54 | -15.89 | -17.64 | -7.4 | 9.09 | 5.7 | -4.28 | 1.5 | 14.8 | 5.7 | 2.88 | 0.56 | 3.69 | 8.29 | 4.04 | 0.84 | -15.47 |
| 18 | -2.06 | -7.51 | 11.67 | 8.42 | -12.81 | -0.32 | 13.52 | -2.6 | 6.91 | 0.24 | 1.1 | 13.93 | 0.73 | 1.88 | -2.9 | 1.96 | -0.55 | -6.66 | -1.55 | 1.27 | -1.31 |
| 19 | -6.4 | 8.04 | -2.9 | -5.99 | -1.95 | -1.26 | 0.82 | -1.65 | -4.63 | -6.87 | -1.91 | 6.73 | 0.33 | -17.74 | -1.71 | -4.69 | 3.09 | 1.23 | -3.63 | -7.55 | 3.21 |
| 20 | 14.3 | -12.61 | -4.45 | -1.73 | 15.43 | 1.36 | 8.76 | -1.05 | 2.22 | -0.2 | 1.57 | 7.15 | 0.86 | -3.88 | -1.26 | -2.58 | -3.35 | 6.99 | 4.92 | -5.69 | 5.04 |
| 21 | 11.51 | 7.17 | 16.84 | 9.24 | -16.97 | 12.46 | -12.06 | -8.96 | -2.35 | 7.15 | -9.03 | 3.71 | -1.1 | 11.84 | 12.46 | -0.26 | -2 | 1.62 | 6.61 | 8.15 | 1.39 |
| 22 | 3.19 | -5.37 | 1.92 | -3.79 | 5.44 | -0.32 | 1.79 | 1.5 | 6.67 | 6.18 | 9.1 | 7.24 | 2.63 | 11.76 | -0.85 | 4.07 | 0.8 | -0.96 | 5.59 | 7.27 | -1.01 |
| 23 | 5.27 | 13.85 | -2.96 | -0.56 | 3.17 | -11.77 | -6.82 | 2.71 | 4.45 | -2.62 | 1.17 | -1.85 | 3.43 | -1.93 | -7.98 | 2.65 | -0.47 | 4.03 | -4.16 | -11.12 | -10.52 |
Stability ranking (most robust hours first)
| hour | mean_bps | se_bps | t_stat | stability |
|---|---|---|---|---|
| 22 | 3.26 | 1.31 | 2.49 | 0.71 |
| 10 | 0.68 | 1.57 | 0.43 | 0.71 |
| 15 | 1.82 | 1.64 | 1.11 | 0.67 |
| 8 | 1.3 | 1.38 | 0.94 | 0.67 |
| 19 | -0.75 | 1.4 | -0.53 | 0.67 |
| 21 | 3.81 | 1.41 | 2.71 | 0.62 |
| 14 | -1.95 | 1.8 | -1.08 | 0.62 |
| 2 | -1.1 | 1.42 | -0.77 | 0.62 |
| 16 | -0.83 | 1.48 | -0.56 | 0.62 |
| 23 | -2.06 | 1.51 | -1.36 | 0.57 |
| 4 | -1.11 | 1.08 | -1.04 | 0.57 |
| 5 | 0.57 | 1.09 | 0.52 | 0.57 |
| 20 | 2.39 | 1.46 | 1.64 | 0.52 |
| 7 | 1.71 | 1.18 | 1.45 | 0.52 |
| 6 | 1.22 | 1.15 | 1.06 | 0.52 |
| 3 | -0.95 | 1.17 | -0.81 | 0.52 |
| 18 | 0.77 | 1.36 | 0.57 | 0.52 |
| 0 | -0.07 | 1.52 | -0.04 | 0.52 |
| 12 | 1.11 | 1.59 | 0.7 | 0.48 |
| 1 | -0.54 | 1.45 | -0.37 | 0.48 |
| 11 | 0.25 | 1.14 | 0.22 | 0.48 |
| 9 | -0.24 | 1.18 | -0.21 | 0.48 |
| 13 | 1.46 | 1.53 | 0.95 | 0.38 |
| 17 | -0.54 | 1.36 | -0.4 | 0.38 |