CUSUM event sampling + triple-barrier labeling (pipeline pilot)
InconclusiveCUSUM event sampling + triple-barrier labeling (pipeline pilot)
2026-06-06 · status: inconclusive · 6.0s
Hypothesis: The CUSUM event sampler + vol-scaled triple-barrier labeler form a causal, leakage-free research pipeline: CUSUM downsamples noisy bars to meaningful directional moves, triple-barrier gives execution-consistent labels, and the +1 base rate is stable walk-forward (no drift/leakage). Infrastructure check, not an edge claim.
Verdict: INFRASTRUCTURE OK — pipeline runs causally end-to-end. CUSUM cut 55,826 bars to 19,944 events (64.3% downsampling); triple-barrier labels split 49/0/51 (+1/0/−1). +1 base rate ranges 0.44–0.53 across 21 walk-forward windows (spread 0.10) — stable, no drift/leakage. Ready to plug contextual features against the triple-barrier label. No edge claimed here.
Key metrics
| metric | value |
|---|---|
| interval | 1h |
| n_bars | 55,826 |
| n_events | 19,944 |
| downsampling_pct | +64.3000 |
| n_labeled | 19,944 |
| base_rate_up | +0.4910 |
| pct_label_up | +49.1000 |
| pct_label_dn | +50.9000 |
| pct_label_time0 | +0.0000 |
| median_hold_bars | +2.0000 |
| mean_uniqueness | +0.6010 |
| wf_base_rate_spread | +0.0980 |
| n_windows | 21 |
Approach
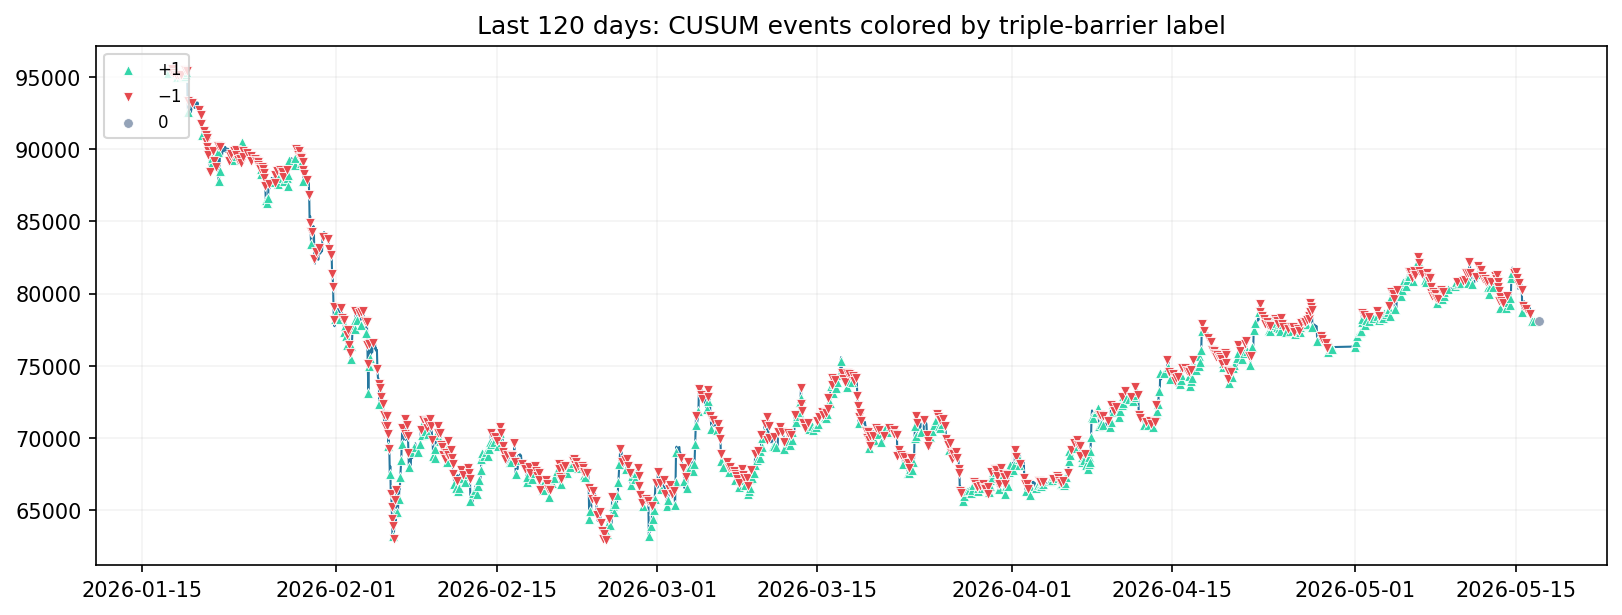
BTC 1h bars. CUSUM threshold = 1.0 × trailing realised vol (std of log returns, 24-bar window). Triple barriers at ±1.5/1.5 vol units with a 24-bar vertical limit; barrier touches checked intrabar via high/low (same-bar double touch → stop, pessimistic). Average-uniqueness weights computed from overlapping [t0, t1] spans. All causal.
Sampling
-
Bars: 55,826 → CUSUM events: 19,944 (64.3% downsampling)
-
Labeled events: 19,944 · median holding to barrier: 2 bars · mean uniqueness: 0.601 (1.0 = no overlap)
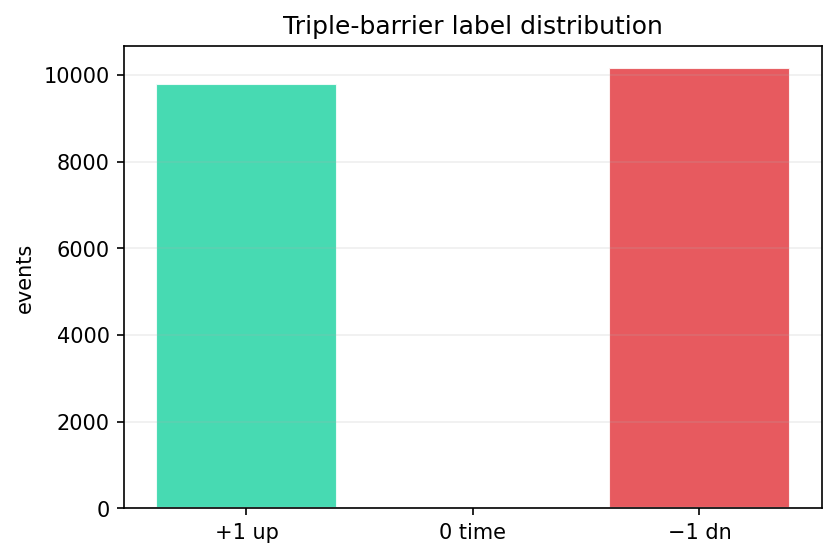
Label distribution
-
+1 (upper first): 9,789 (49.1%)
-
−1 (lower first): 10,154 (50.9%)
-
0 (flat at expiry): 1 (0.0%)
-
Barrier hit: up=9,715 · dn=10,083 · time=146
Walk-forward +1 base-rate stability (21 windows)
| window | n | base_rate_up | events_per_day |
|---|---|---|---|
| 2021-01-02 → 2021-04-02 | 849 | 0.508 | 9.43 |
| 2021-04-02 → 2021-07-02 | 857 | 0.455 | 9.42 |
| 2021-07-02 → 2021-10-02 | 763 | 0.489 | 8.29 |
| 2021-10-02 → 2022-01-02 | 782 | 0.473 | 8.5 |
| 2022-01-02 → 2022-04-02 | 750 | 0.519 | 8.33 |
| 2022-04-02 → 2022-07-02 | 787 | 0.471 | 8.65 |
| 2022-07-02 → 2022-10-02 | 762 | 0.516 | 8.28 |
| 2022-10-02 → 2023-01-02 | 742 | 0.466 | 8.07 |
| 2023-01-02 → 2023-04-02 | 676 | 0.497 | 7.51 |
| 2023-04-02 → 2023-07-02 | 725 | 0.506 | 7.97 |
| 2023-07-02 → 2023-10-02 | 780 | 0.488 | 8.48 |
| 2023-10-02 → 2024-01-02 | 784 | 0.534 | 8.52 |
| 2024-01-02 → 2024-04-02 | 787 | 0.492 | 8.65 |
| 2024-04-02 → 2024-07-02 | 761 | 0.484 | 8.36 |
| 2024-07-02 → 2024-10-02 | 803 | 0.492 | 8.73 |
| 2024-10-02 → 2025-01-02 | 798 | 0.503 | 8.67 |
| 2025-01-02 → 2025-04-02 | 813 | 0.501 | 9.03 |
| 2025-04-02 → 2025-07-02 | 815 | 0.51 | 8.96 |
| 2025-07-02 → 2025-10-02 | 844 | 0.493 | 9.17 |
| 2025-10-02 → 2026-01-02 | 792 | 0.458 | 8.61 |
| 2026-01-02 → 2026-04-02 | 796 | 0.436 | 8.84 |