Direction Stage 1 — GBM baseline reality check
DroppedDirection Stage 1 — GBM baseline reality check
2026-05-17 · status: dropped · 12.7s
Hypothesis: A gradient-boosting regressor trained on ~40 causal statistical features extracts a directional edge — IC > 0.02 on vol-normalised forward 4h log returns, walk-forward, stable across ≥ 70% of windows.
Verdict: DEAD — only 1/3 gates pass. Pooled IC +0.0148, spread +5.2 bps, stability 76.2%. The dataset does not contain an extractable directional edge with these features. Honest finding — no parameter tuning. Next: either richer data (orderbook, on-chain, cross-asset) or accept that vol-targeting is the ceiling.
Key metrics
| metric | value |
|---|---|
| n_features | 33 |
| n_windows | 21 |
| pooled_IC | +0.0148 |
| pooled_IC_CI | [-0.0046, +0.0307] |
| long_short_bps | +5.1952 |
| long_short_t_stat | +1.4248 |
| positive_IC_rate_pct | +76.1905 |
| gates_passed | 1 |
| gates_total | 3 |
Approach
Target: vol-normalised forward 240min log return — i.e. fwd_ret_4h / (rv_4h × √240). This stabilises the target across vol regimes (more stationary → easier for tree models). The raw return is kept alongside for actionable spread computation.
Features: 33 causal statistics — past returns at 5 horizons, vol at 4 windows, Parkinson vol at 3 windows, vol-normalised past returns, distribution moments, volume/trade z-scores, range compression metrics, drawdown / runup, time-of-day & day-of-week. Walk-forward: 12mo train, 3mo test, 1-day embargo, 21 windows.
Promote gates — ALL must pass: - Pooled Spearman IC > 0.020 - Long-short quintile spread (top - bottom, raw fwd 4h return) > 30 bps - Positive IC in ≥ 70% of walk-forward windows
If any gate fails, verdict is DEAD — no parameter tuning to chase green.
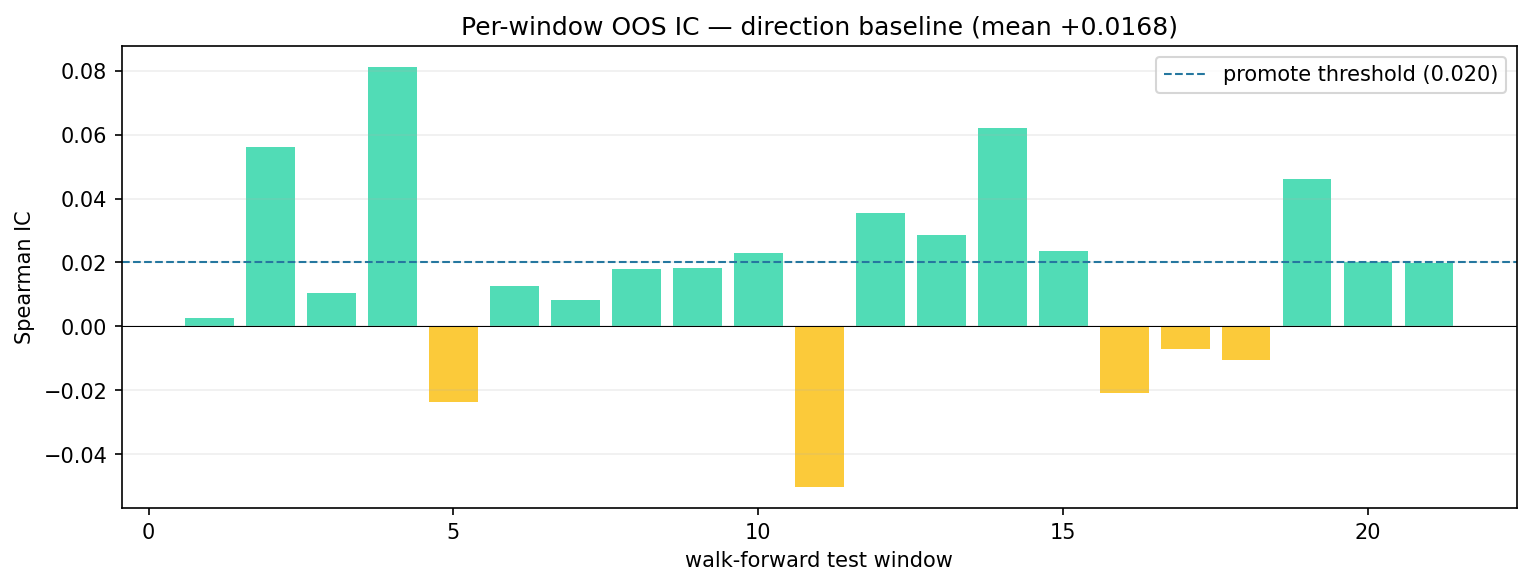
1. Walk-forward IC
- Pooled Spearman IC (non-overlapping 4h samples): +0.0148 (n = 11,496, 95% CI [-0.0046, +0.0307])
- Per-window IC: min -0.0503, max +0.0811, mean +0.0168
- Positive-IC windows: 16 / 21 (76.2%)
| window | test_start | test_end | n | IC |
|---|---|---|---|---|
| 1 | 2021-01-05 | 2021-04-05 | 2160 | 0.0027 |
| 2 | 2021-04-05 | 2021-07-05 | 2184 | 0.0561 |
| 3 | 2021-07-05 | 2021-10-05 | 2208 | 0.0104 |
| 4 | 2021-10-05 | 2022-01-05 | 2208 | 0.0811 |
| 5 | 2022-01-05 | 2022-04-05 | 2160 | -0.0238 |
| 6 | 2022-04-05 | 2022-07-05 | 2184 | 0.0125 |
| 7 | 2022-07-05 | 2022-10-05 | 2208 | 0.0082 |
| 8 | 2022-10-05 | 2023-01-05 | 2208 | 0.018 |
| 9 | 2023-01-05 | 2023-04-05 | 2160 | 0.0182 |
| 10 | 2023-04-05 | 2023-07-05 | 2184 | 0.0229 |
| 11 | 2023-07-05 | 2023-10-05 | 2208 | -0.0503 |
| 12 | 2023-10-05 | 2024-01-05 | 2208 | 0.0353 |
| 13 | 2024-01-05 | 2024-04-05 | 2184 | 0.0286 |
| 14 | 2024-04-05 | 2024-07-05 | 2184 | 0.0619 |
| 15 | 2024-07-05 | 2024-10-05 | 2208 | 0.0237 |
| 16 | 2024-10-05 | 2025-01-05 | 2207 | -0.0209 |
| 17 | 2025-01-05 | 2025-04-05 | 2160 | -0.007 |
| 18 | 2025-04-05 | 2025-07-05 | 2184 | -0.0105 |
| 19 | 2025-07-05 | 2025-10-05 | 2208 | 0.046 |
| 20 | 2025-10-05 | 2026-01-05 | 2208 | 0.0201 |
| 21 | 2026-01-05 | 2026-04-05 | 2160 | 0.0199 |
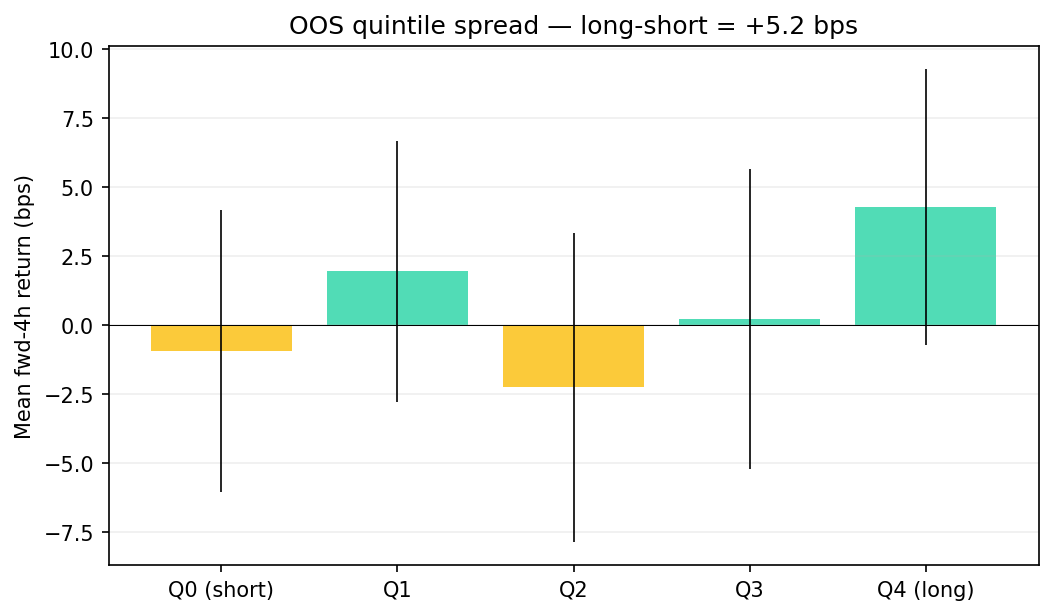
2. Quintile spread (raw 4h returns)
Sort each OOS observation by prediction, bucket into 5 quintiles. Q0 = lowest predictions (would short), Q4 = highest (would long). For a strategy to be useful, Q4 - Q0 must be large enough to cover fees.
| q | n | mean_pred | mean_target_norm | mean_bps | se_bps | t_stat |
|---|---|---|---|---|---|---|
| 0 | 2300 | -0.3641 | -0.0049 | -0.93 | 2.61 | -0.36 |
| 1 | 2299 | -0.0992 | 0.0024 | 1.94 | 2.41 | 0.8 |
| 2 | 2299 | 0.0226 | -0.0058 | -2.27 | 2.85 | -0.79 |
| 3 | 2299 | 0.1426 | -0.011 | 0.21 | 2.77 | 0.08 |
| 4 | 2299 | 0.4374 | 0.0343 | 4.26 | 2.55 | 1.67 |
- Long-short spread Q4 - Q0: +5.2 bps per 4h hold (SE ≈ 3.65, t ≈ +1.42)
Production gates
| gate | pass? | actual |
|---|---|---|
| pooled IC > 0.020 | FAIL | +0.0148 |
| quintile spread > 30 bps | FAIL | +5.2 bps |
| positive IC in ≥ 70% windows | OK | 76.2% |
Passed: 1/3