Funding extreme reversal
InconclusiveFunding extreme reversal
2026-05-17 · status: inconclusive · 1.2s
Hypothesis: Extreme funding rates predict directional reversals in the next 24h: very negative funding → squeeze higher; very positive funding → mean revert lower. Tested walk-forward on funding z-score quintiles.
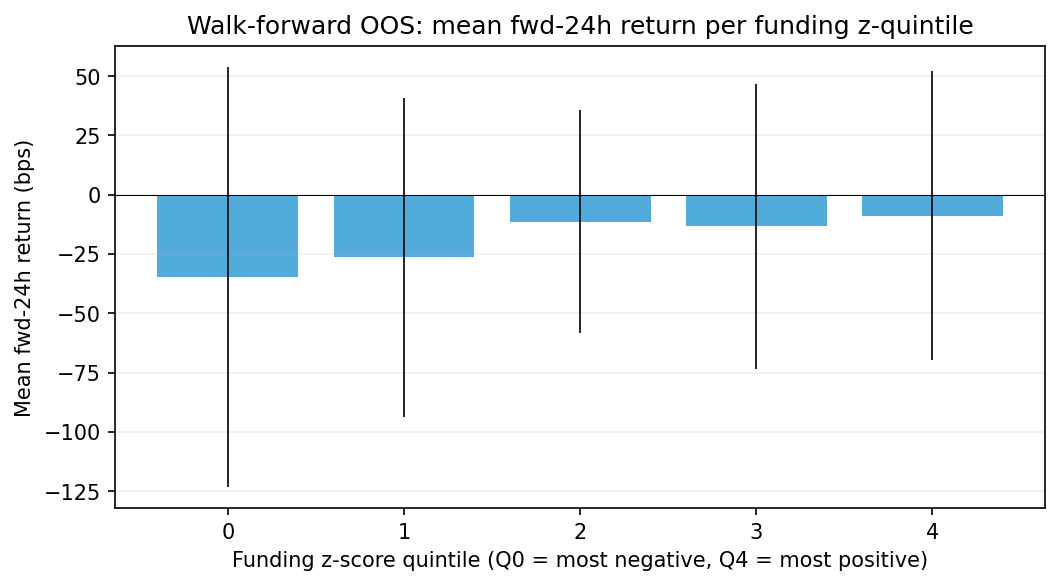
Verdict: INCONCLUSIVE — Q0=-34.7 bps (t=-0.8), Q4=-8.9 bps (t=-0.3). Magnitudes hint at vol-driven returns (both tails positive) rather than clean directional mean-reversion. Re-examine: is this an absolute-return effect rather than a directional one?
Key metrics
| metric | value |
|---|---|
| Q0_mean_bps | -34.7361 |
| Q0_t_stat | -0.7690 |
| Q4_mean_bps | -8.9396 |
| Q4_t_stat | -0.2876 |
| n_windows | 7 |
Approach
We attach the 8h funding rate to 1m bars, compute its 30-day rolling z-score, then sample one observation per calendar day (so consecutive fwd-24h windows do not overlap). Each daily observation is bucketed by funding z-score quintile, computed within each walk-forward training window only (no in-sample leakage) and applied to the corresponding test window.
Daily observations: 1,067
Walk-forward windows: 7
Pooled OOS per quintile
Each test window contributes one mean per quintile. We then pool across windows: mean = mean of window-means, se = std/sqrt(n_windows). t_stat measures consistency across windows.
| q | mean_bps | se_bps | t_stat | n_windows | total_obs |
|---|---|---|---|---|---|
| 0 | -34.74 | 45.17 | -0.77 | 7 | 98 |
| 1 | -26.32 | 34.33 | -0.77 | 7 | 121 |
| 2 | -11.3 | 24.05 | -0.47 | 7 | 148 |
| 3 | -13.28 | 30.69 | -0.43 | 7 | 156 |
| 4 | -8.94 | 31.09 | -0.29 | 7 | 118 |
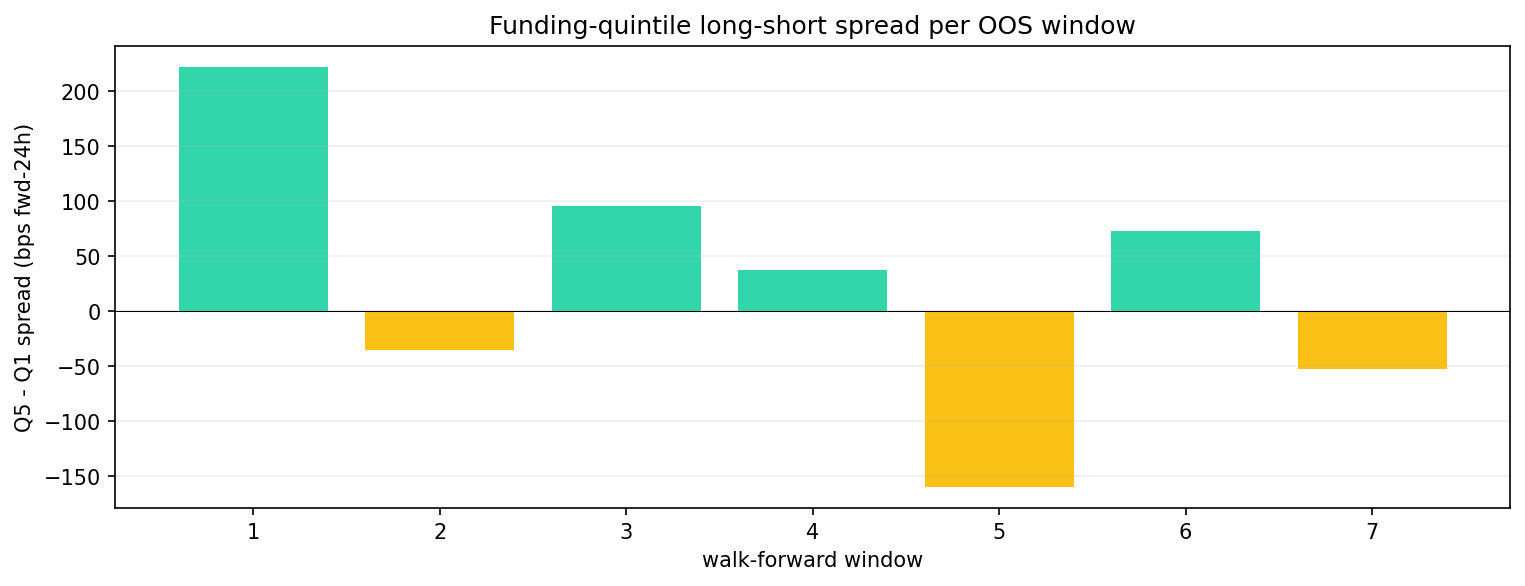
Long-Q5 / short-Q1 spread per window (bps fwd-24h)
| window | 0 | 1 | 2 | 3 | 4 | spread |
|---|---|---|---|---|---|---|
| 1 | -261.93 | 10.6 | -7.76 | 2.34 | -39.93 | 222 |
| 2 | 121.53 | 81.29 | 29.88 | -14.74 | 85.98 | -35.55 |
| 3 | -76.52 | 65.18 | 4.15 | -167.58 | 19.26 | 95.78 |
| 4 | -65.66 | -114.29 | 74.13 | 88.42 | -27.89 | 37.78 |
| 5 | 16.45 | 17.89 | -40.79 | 55.05 | -143.32 | -159.77 |
| 6 | 17.55 | -120.28 | -8.38 | -33.12 | 90.71 | 73.16 |
| 7 | 5.43 | -124.65 | -130.36 | -23.32 | -47.39 | -52.82 |