Vol-forecast calibration check
DoneVol-forecast calibration check
2026-05-19 · status: done · 7.3s
Hypothesis: The walk-forward GBM forecasts at the 4h horizon are well-calibrated: low mean bias, reliability close to the y=x line across deciles, ~50% of realisations exceeding the forecast (median calibration), and sensible tail behaviour.
Verdict: SHIP WITH CORRECTION — 3/4 gates pass. Failing: median calibration (over_rate 0.45-0.55). Apply a simple bias correction (multiplicative scalar = mean_act / mean_pred = 1.0442) inside the sizing helper before live use.
Key metrics
| metric | value |
|---|---|
| n_obs | 45,984 |
| mean_pred_ann | +0.5036 |
| mean_actual_ann | +0.5258 |
| rel_bias_pct | -4.2284 |
| over_rate_pct | +44.1023 |
| max_decile_err | +0.0611 |
| top_decile_hit_pct | +60.0348 |
| bottom_decile_hit_pct | +64.0139 |
| gates_passed | 3 |
| gates_total | 4 |
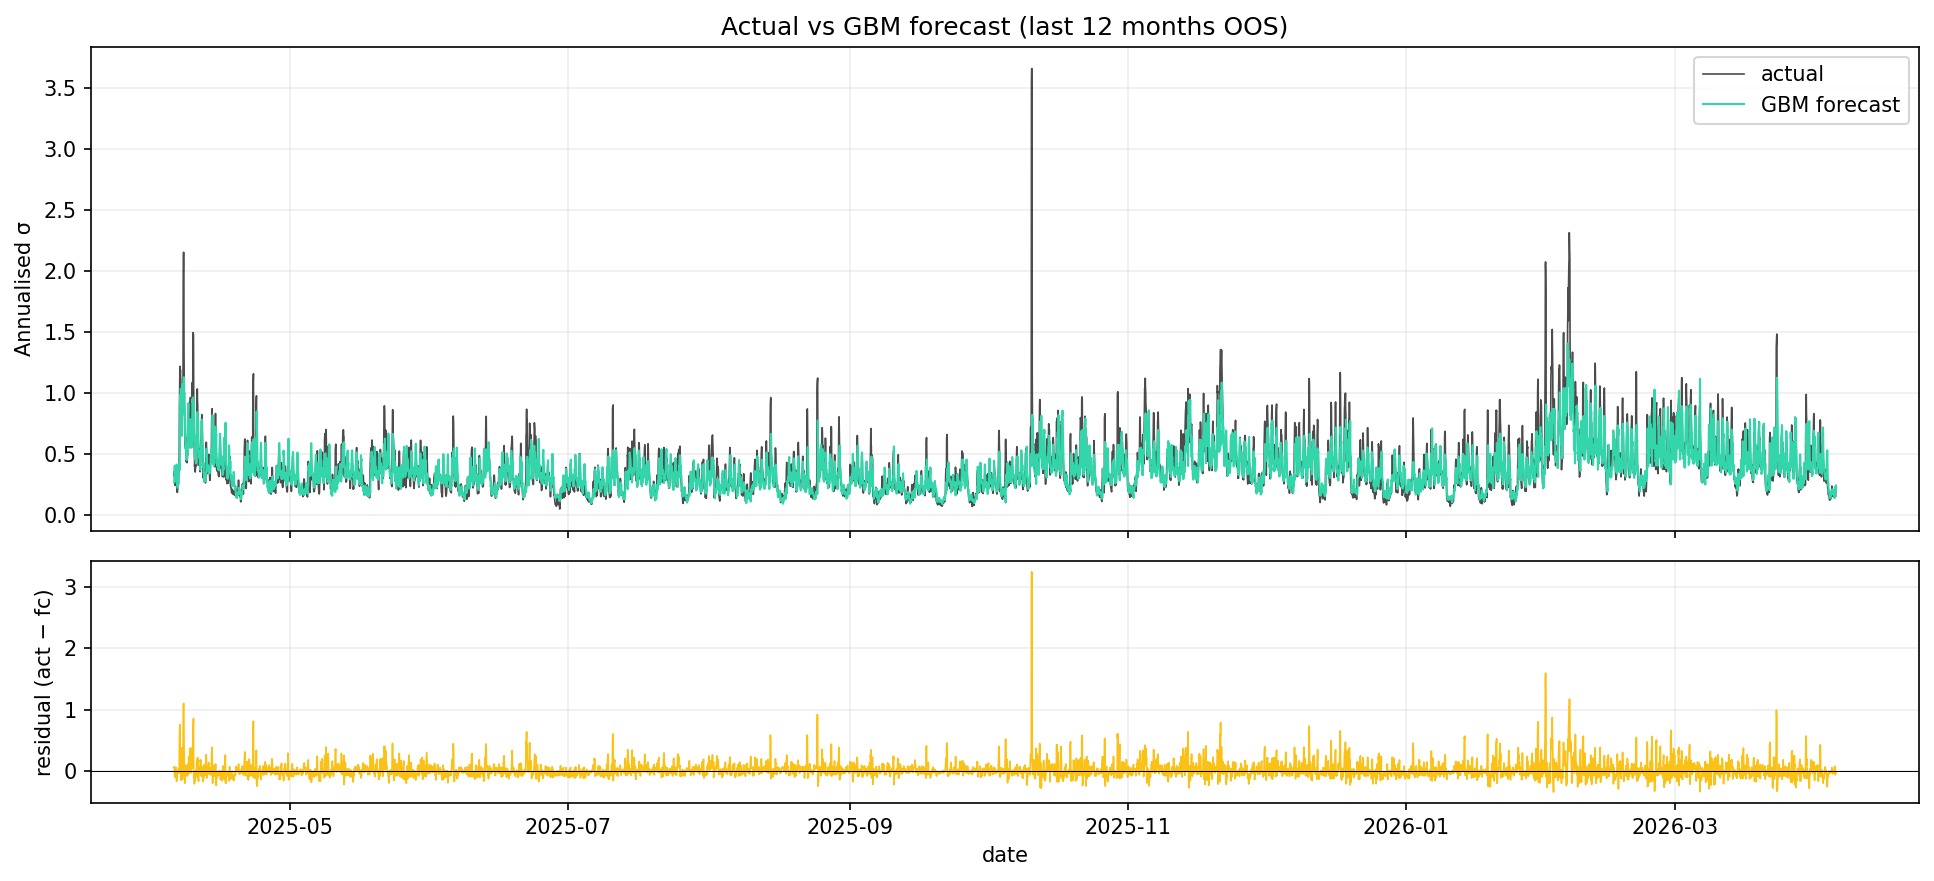
Approach
Diagnostics on 45,984 OOS forecasts (GBM, 4h horizon, walk-forward 12mo train / 3mo test, 21 windows). All numbers below are annualised σ (so 0.50 = 50% annual vol).
1. Bias
- Mean forecast: 0.5036 (= 50.36% ann)
- Mean actual: 0.5258 (= 52.58% ann)
- Absolute bias (forecast − actual): -0.0222
- Relative bias: -4.23%
- Median forecast vs median actual: 0.4591 vs 0.4421
Interpretation: |relative bias| under 5% is acceptable for sizing use; > 10% would require recalibration before live.
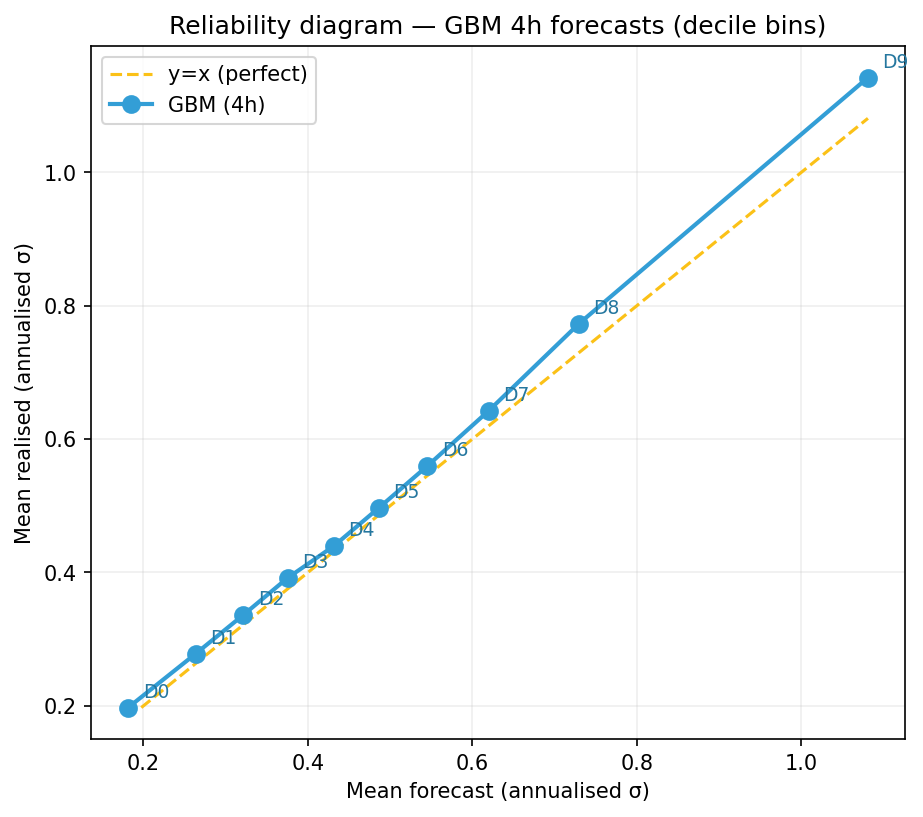
2. Reliability — decile bins
Sorted by forecast decile (decile 0 = lowest forecasts, decile 9 = highest). Within each decile we compare mean forecast vs mean realised. Perfect calibration: pred_mean ≈ act_mean in every bin.
| bin | n | pred_mean | act_mean | pred_p50 | act_p50 | abs_err | rel_err_pct |
|---|---|---|---|---|---|---|---|
| 0 | 4599 | 0.1815 | 0.1974 | 0.1893 | 0.1797 | -0.016 | -8.08 |
| 1 | 4598 | 0.2638 | 0.2784 | 0.2643 | 0.2539 | -0.0146 | -5.24 |
| 2 | 4598 | 0.3217 | 0.3366 | 0.3222 | 0.3075 | -0.0148 | -4.41 |
| 3 | 4599 | 0.3752 | 0.3917 | 0.3751 | 0.3607 | -0.0165 | -4.21 |
| 4 | 4598 | 0.4315 | 0.4397 | 0.4319 | 0.4037 | -0.0082 | -1.86 |
| 5 | 4598 | 0.4864 | 0.4971 | 0.4863 | 0.4567 | -0.0106 | -2.14 |
| 6 | 4599 | 0.5452 | 0.5596 | 0.5446 | 0.5161 | -0.0144 | -2.58 |
| 7 | 4598 | 0.62 | 0.6427 | 0.6191 | 0.5968 | -0.0227 | -3.53 |
| 8 | 4598 | 0.7294 | 0.7728 | 0.7261 | 0.7171 | -0.0434 | -5.62 |
| 9 | 4599 | 1.0809 | 1.1419 | 0.9742 | 0.9963 | -0.0611 | -5.35 |
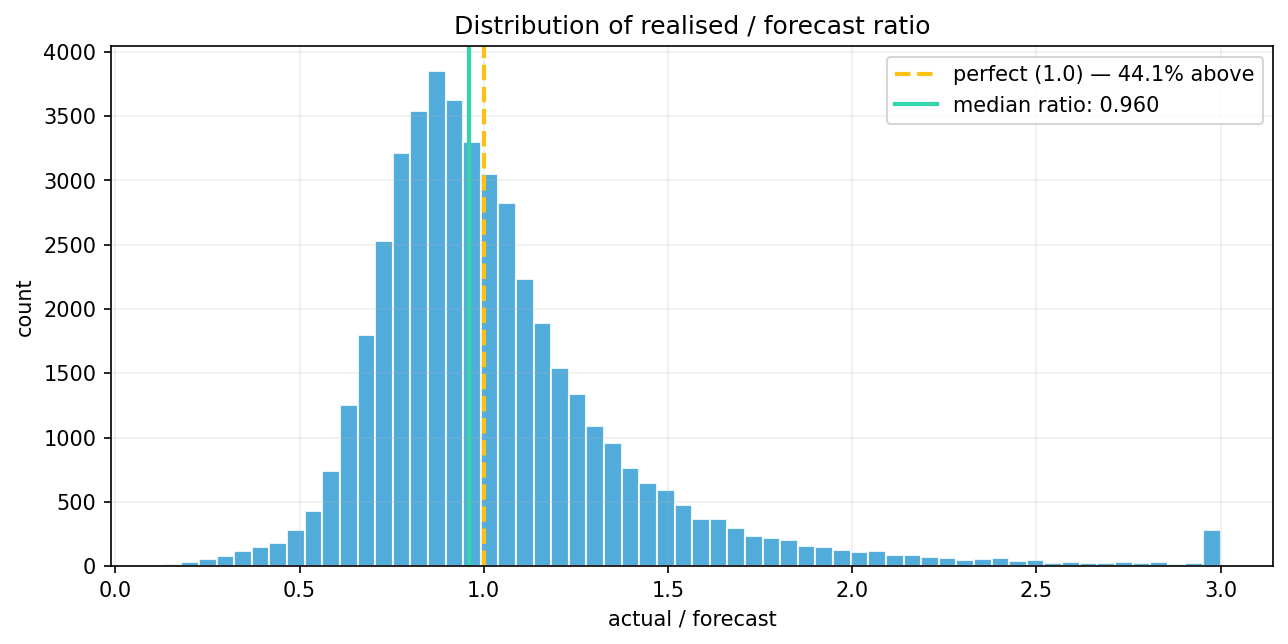
3. Coverage
- P(actual > forecast): 44.10% (target ≈ 50% if forecast is unbiased median)
- P(actual > 1.5× forecast) — model under-shoots big: 8.90%
- P(actual < 0.67× forecast) — model over-shoots calm: 8.17%
4. Tail behaviour
High-vol tail (forecast top-10%, threshold = 0.810)
- Mean actual when forecast in top-10%: 1.142 (global mean 0.526, top-10% threshold of actuals 0.914)
- Hit rate — fraction of high-forecast cases where actual was also in the top-10%: 60.0% (random baseline = 10%)
- Reverse: mean forecast when actual is in top-10%: 0.964
Low-vol tail (forecast bottom-10%, threshold = 0.231)
- Mean actual when forecast in bottom-10%: 0.197
- Hit rate for bottom decile: 64.0% (random baseline = 10%)
- Reverse: mean forecast when actual is in bottom-10%: 0.223
Production gates
| gate | pass? | actual |
|---|---|---|
| bias <5% | OK | -4.23% |
| median calibration (over_rate 0.45-0.55) | FAIL | 44.1% |
| max decile error <0.10 | OK | 0.0611 |
| tail hit-rate >30% | OK | 60.0% |
Passed: 3/4