Vol forecasting: persistence vs HAR-RV vs GBM
PromotedHypothesis
A richer model (HAR-RV or gradient boosting) improves on naive persistence (forecast = trailing rv) as a forward-vol forecaster, walk-forward at 1h / 4h / 1d horizons.
Verdict
**SHIP** — at the 4h horizon, **GBM** beats persistence: IC +0.836 vs +0.745 (R² +0.700 vs +0.546). Wire `ml.forecast.predict_vol_4h` into strategies/ for position sizing and entry filtering.
GBM_IC_4h
+0.8363
GBM_R2_4h
+0.7004
HAR-RV_IC_4h
+0.7936
HAR-RV_R2_4h
+0.6564
uplift_IC_pp
+9.1019
best_model_4h
GBM
Persistence_IC_4h
+0.7452
Persistence_R2_4h
+0.5460
Vol forecasting: persistence vs HAR-RV vs GBM
2026-05-19 · status: promoted · 20.3s
Hypothesis: A richer model (HAR-RV or gradient boosting) improves on naive persistence (forecast = trailing rv) as a forward-vol forecaster, walk-forward at 1h / 4h / 1d horizons.
Verdict: SHIP — at the 4h horizon, GBM beats persistence: IC +0.836 vs +0.745 (R² +0.700 vs +0.546). Wire
ml.forecast.predict_vol_4hinto strategies/ for position sizing and entry filtering.
Key metrics
| metric | value |
|---|---|
| best_model_4h | GBM |
| Persistence_IC_4h | +0.7452 |
| HAR-RV_IC_4h | +0.7936 |
| GBM_IC_4h | +0.8363 |
| Persistence_R2_4h | +0.5460 |
| HAR-RV_R2_4h | +0.6564 |
| GBM_R2_4h | +0.7004 |
| uplift_IC_pp | +9.1019 |
Approach
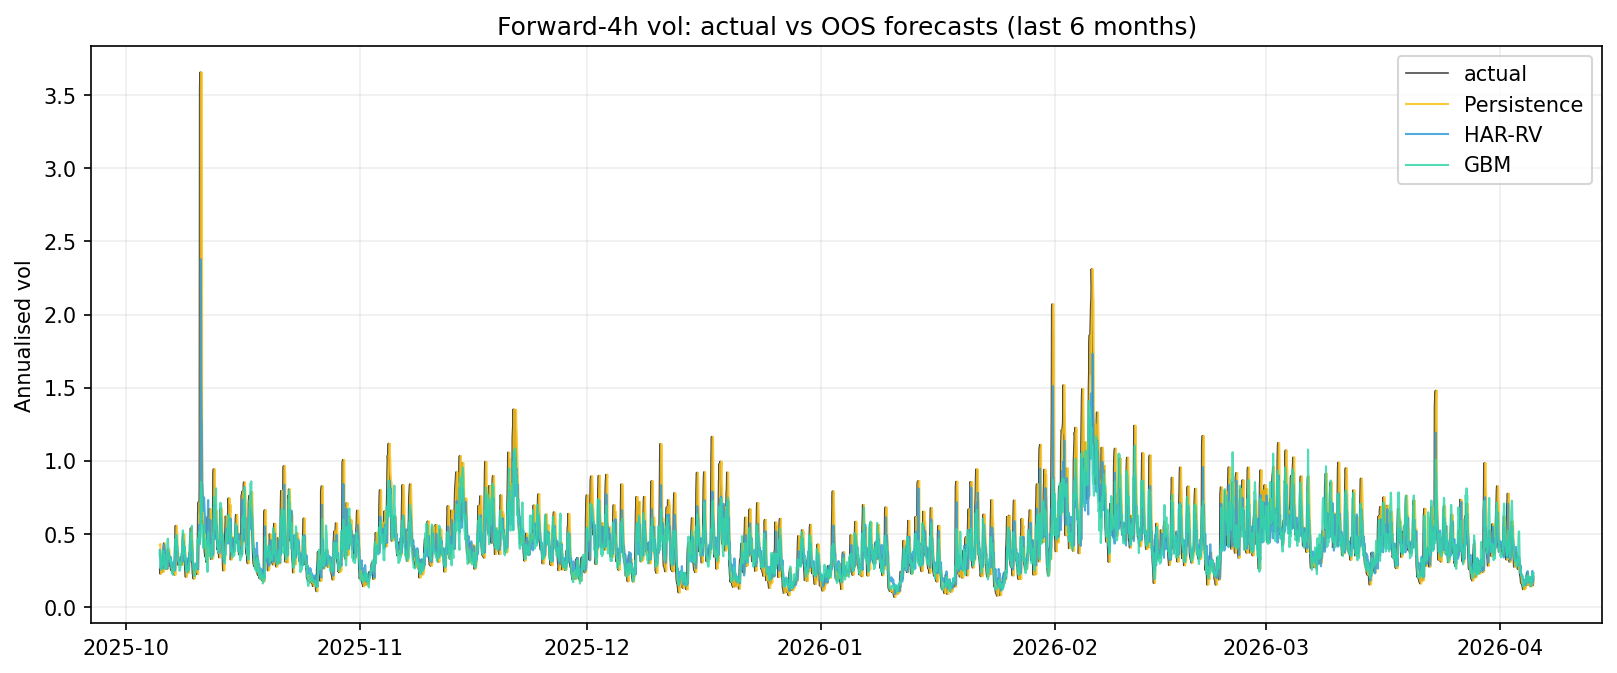
We forecast the log of forward realised volatility at three horizons (1h, 4h, 1d). Three models compete on the same hourly panel:
- Persistence —
forecast = trailing log(rv_h). The Exp 1 baseline. - HAR-RV (Corsi 2009) — linear regression of log(forward rv) on log (trailing rv_1h, rv_4h, rv_1d). The classic econometric vol forecaster.
- GBM — gradient-boosted regression on all features (rv at 4 windows, ret_24h, ret_4h, range_4h, range_1d, log_vol_z_1d, hour, dow).
Walk-forward: 12 months train, 3 months test, 1-day embargo. Out-of-sample predictions are concatenated across all windows then scored against actual forward vol.
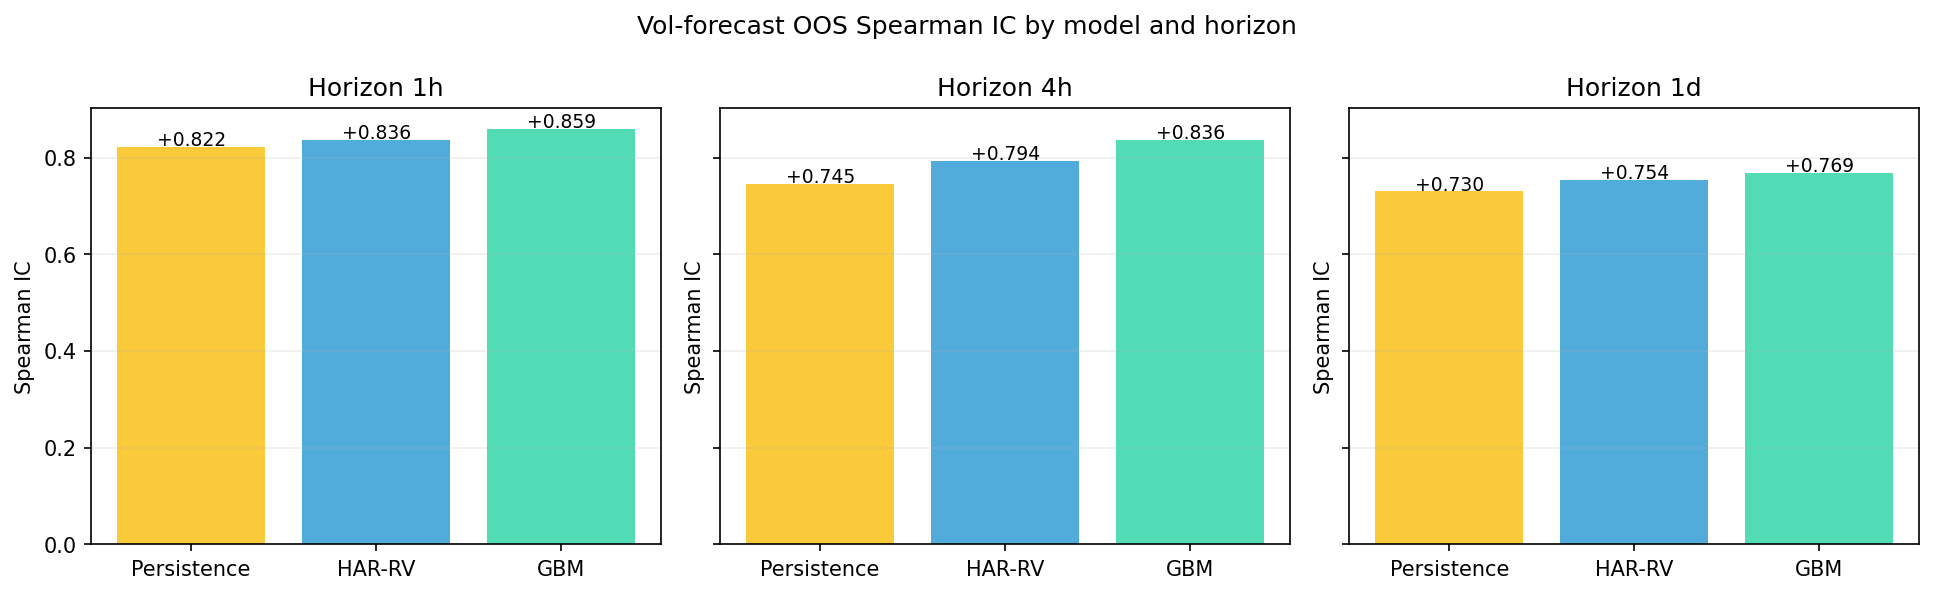
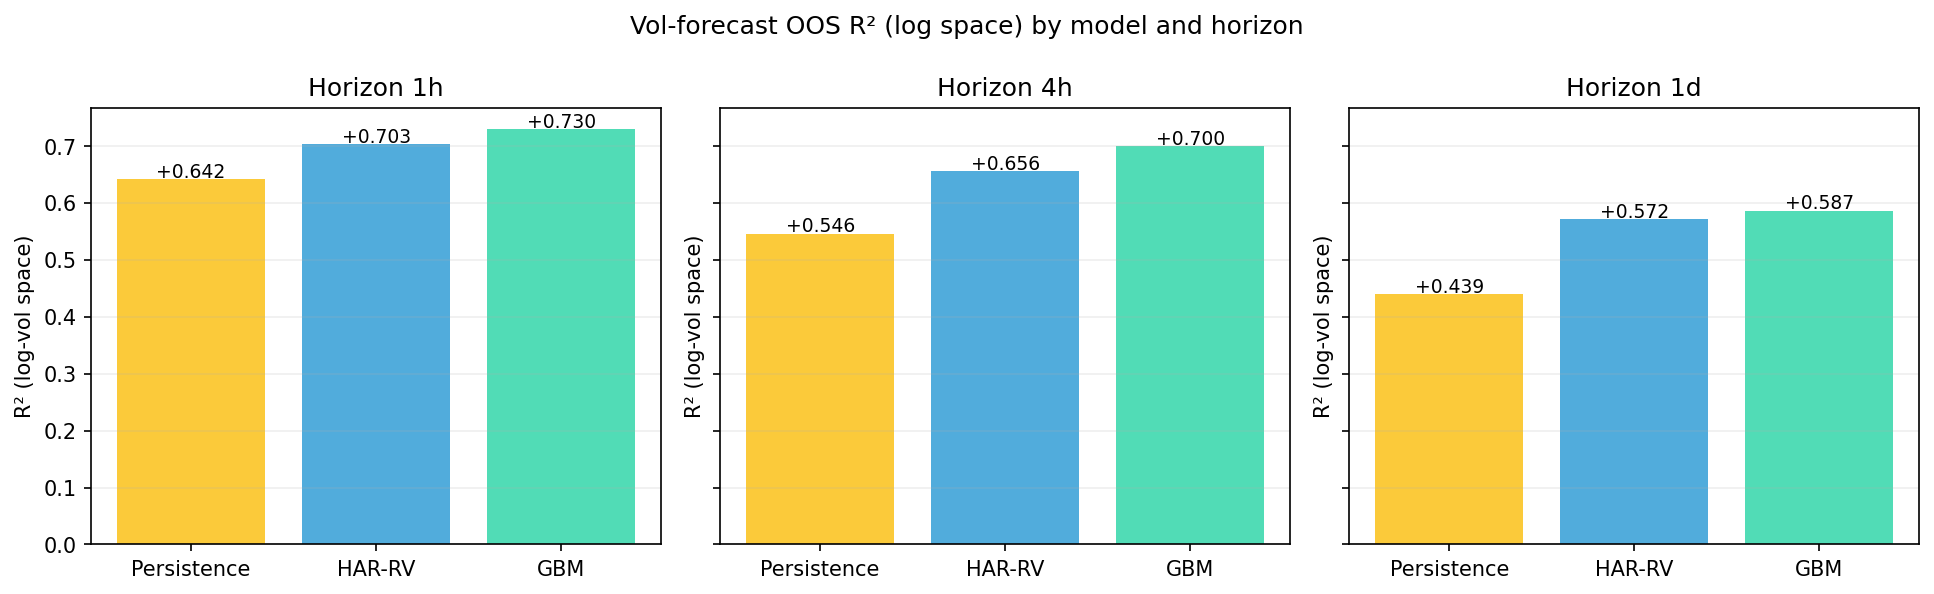
OOS comparison (concatenated across all walk-forward windows)
Horizon 1h
| model | n | spearman_ic | pearson_r | r2_log | mae_log | hit_rate | rmse_vol_ann |
|---|---|---|---|---|---|---|---|
| Persistence | 45984 | 0.8215 | 0.8212 | 0.6424 | 0.2815 | 0.8211 | 0.2993 |
| HAR-RV | 45984 | 0.8361 | 0.8388 | 0.7034 | 0.2592 | 0.8269 | 0.2641 |
| GBM | 45984 | 0.8595 | 0.8547 | 0.7304 | 0.2433 | 0.841 | 0.2538 |
Horizon 4h
| model | n | spearman_ic | pearson_r | r2_log | mae_log | hit_rate | rmse_vol_ann |
|---|---|---|---|---|---|---|---|
| Persistence | 45984 | 0.7452 | 0.773 | 0.546 | 0.3121 | 0.7692 | 0.295 |
| HAR-RV | 45984 | 0.7936 | 0.8103 | 0.6564 | 0.2723 | 0.7971 | 0.2493 |
| GBM | 45984 | 0.8363 | 0.8369 | 0.7004 | 0.2428 | 0.8276 | 0.2373 |
Horizon 1d
| model | n | spearman_ic | pearson_r | r2_log | mae_log | hit_rate | rmse_vol_ann |
|---|---|---|---|---|---|---|---|
| Persistence | 45984 | 0.7299 | 0.7199 | 0.4394 | 0.2893 | 0.7771 | 0.2532 |
| HAR-RV | 45984 | 0.7545 | 0.756 | 0.5715 | 0.2535 | 0.7855 | 0.2217 |
| GBM | 45984 | 0.7685 | 0.7711 | 0.5867 | 0.2437 | 0.7931 | 0.2236 |