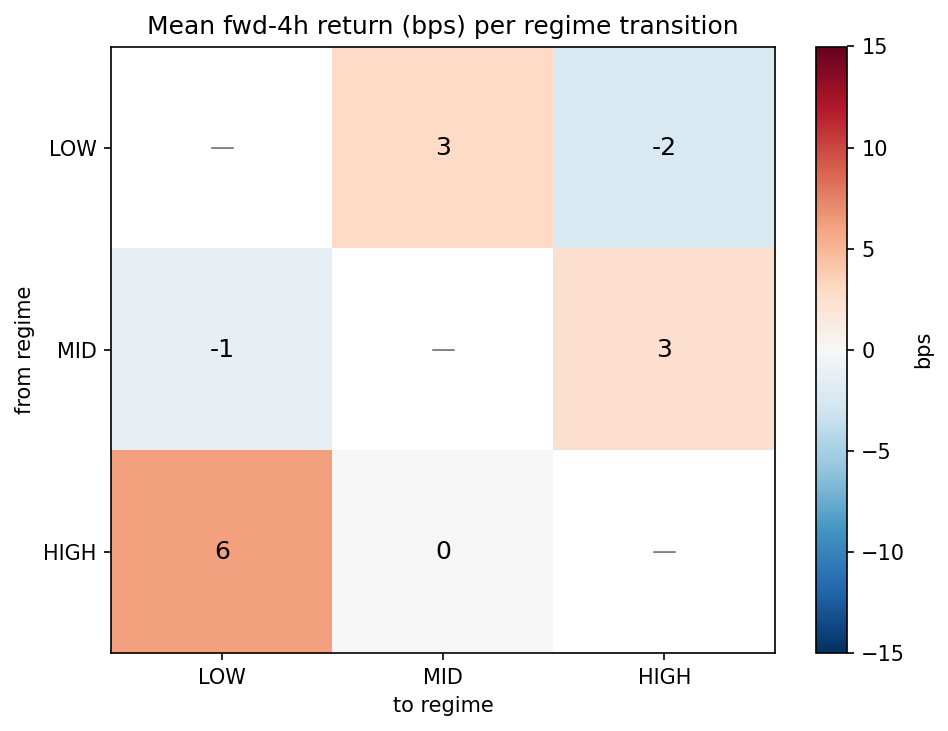
Vol-regime transitions: directional reaction at boundary crossings
DroppedVol-regime transitions: directional reaction at boundary crossings
2026-05-17 · status: dropped · 0.7s
Hypothesis: When trailing rv_4h transitions between regime terciles (low/mid/high), BTC shows a directional bias in the next 4h that's distinct from non-transition hours. At least one (from→to) cell passes |mean| > 15 bps, |t| > 2, stability ≥ 60% walk-forward.
Verdict: DEAD — strongest transition cell only +6.2 bps (t +0.14). Vol regime changes are no more informative than vol levels — direction at the transition is noise. Confirms vol-as-sizing is the only edge in this data.
Key metrics
| metric | value |
|---|---|
| n_transition_events | 3,757 |
| n_cells | 6 |
| n_robust | 0 |
| strongest_cell | HIGH → LOW |
| strongest_mean_bps | +6.1792 |
| strongest_t_stat | +0.1387 |
| strongest_stability | +1.0000 |
| n_windows | 21 |
Approach
Hourly rv_4h classified into 3 terciles using cuts learned on each walk-forward training segment, applied to test. A transition is hour t where the regime differs from hour t-1 AND the previous regime held for ≥ 4h (filters out single-bar noise). Forward 4h return computed at transition timestamp.
6 transition cells (3×3 minus diagonal). Promote gate: ≥ 1 cell with pooled |mean| > 15 bps, |t| > 2.0, stability ≥ 60% across walk-forward windows.
Total sustained transition events: 3,757
Per-transition results
| cell | n_total | n_windows | mean_bps | se_bps | t_stat | stability |
|---|---|---|---|---|---|---|
| HIGH → LOW | 5 | 1 | 6.2 | 44.55 | 0.14 | 1 |
| LOW → MID | 969 | 20 | 3 | 3.99 | 0.76 | 0.65 |
| MID → HIGH | 607 | 21 | 2.5 | 6.15 | 0.41 | 0.48 |
| LOW → HIGH | 70 | 9 | -2.3 | 20.41 | -0.11 | 0.44 |
| MID → LOW | 896 | 20 | -1.2 | 3.39 | -0.36 | 0.45 |
| HIGH → MID | 1169 | 21 | 0 | 3.32 | 0 | 0.43 |
Robust cells
None — no transition cell passes all three gates.