VPIN — Volume-synchronised Order-Flow Toxicity
DroppedVPIN — Volume-synchronised Order-Flow Toxicity
2026-05-19 · status: dropped · 9.0s
Hypothesis: Bulk-volume-classification VPIN at 5-min buckets rank-correlates with |forward 1h return| at IC ≥ 0.05 walk-forward; top-quintile VPIN bars are disproportionately followed by large absolute returns.
Verdict: WEAK/DEAD — pooled IC -0.0063 below the 0.03 bar. BVC-derived VPIN on 1m bars doesn't carry enough taker-side signal to predict forward absolute returns. The real signal likely sits in raw taker buy/sell volume from Binance derivatives (richer than CDF-classified).
Key metrics
| metric | value |
|---|---|
| pooled_IC | -0.0063 |
| pooled_CI | [-0.0148, +0.0017] |
| pooled_n | 55,819 |
| windows_pos | 15 |
| n_windows | 21 |
| stability | +0.7143 |
| extreme_hit_rate | +0.0909 |
| extreme_lift_x | +0.9086 |
| vpin_q95 | +0.3046 |
Approach
Bulk Volume Classification on 1m BTC bars (z = r / rolling-σ over 60m, p_buy = Φ(z)) → aggregate to 5min buckets → VPIN = rolling mean of |B−S|/V over last 50 buckets (~4h). Feature: VPIN at bucket end. Label: |fwd-60m log return|. Sampled every 12 buckets (~1h) to reduce autocorrelation.
Walk-forward: 12mo train / 3mo test, embargo = 1440 min. Bootstrap 95% CI on Spearman IC.
Pooled OOS
-
Pooled Spearman IC:
-0.0063(n=55,819) -
Bootstrap 95% CI:
[-0.0148, +0.0017] -
p-value:
0.136
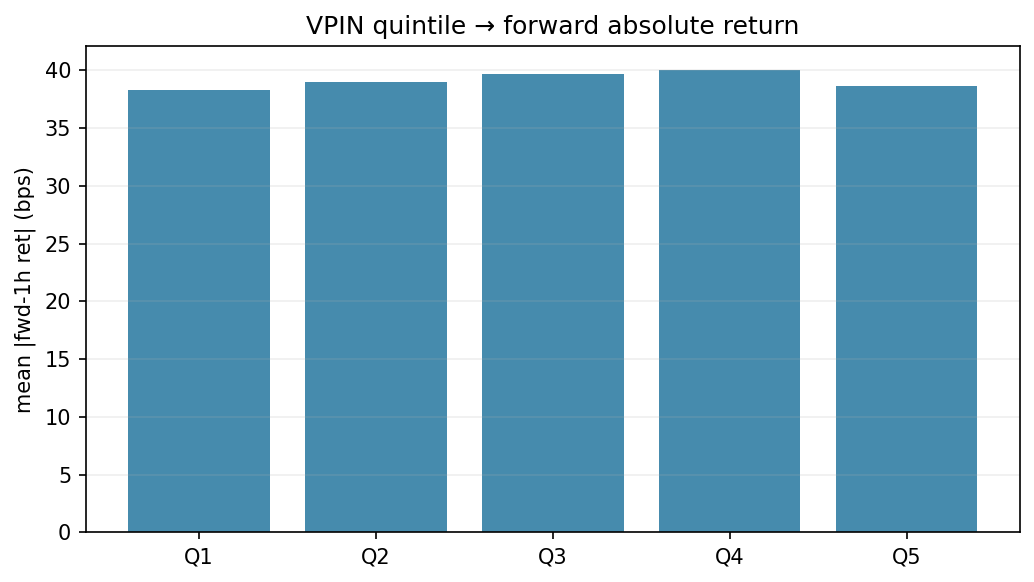
Quintile table — |fwd-1h return| by VPIN quintile
| q | count | mean_bps | median_bps | std |
|---|---|---|---|---|
| 0 | 133965 | 38.3 | 23 | 0.005531 |
| 1 | 133965 | 39 | 23.7 | 0.005169 |
| 2 | 133964 | 39.7 | 24 | 0.005129 |
| 3 | 133965 | 40.1 | 23.8 | 0.005612 |
| 4 | 133965 | 38.6 | 22.1 | 0.005329 |
Extreme-event hit rate
-
VPIN > Q95 threshold:
0.3046 -
|fwd-1h ret| > Q90 threshold:
89.1 bps -
Hits / extreme-VPIN bars:
3043 / 33,492= 9.1% (baseline 10%) -
Lift over baseline:
0.91×
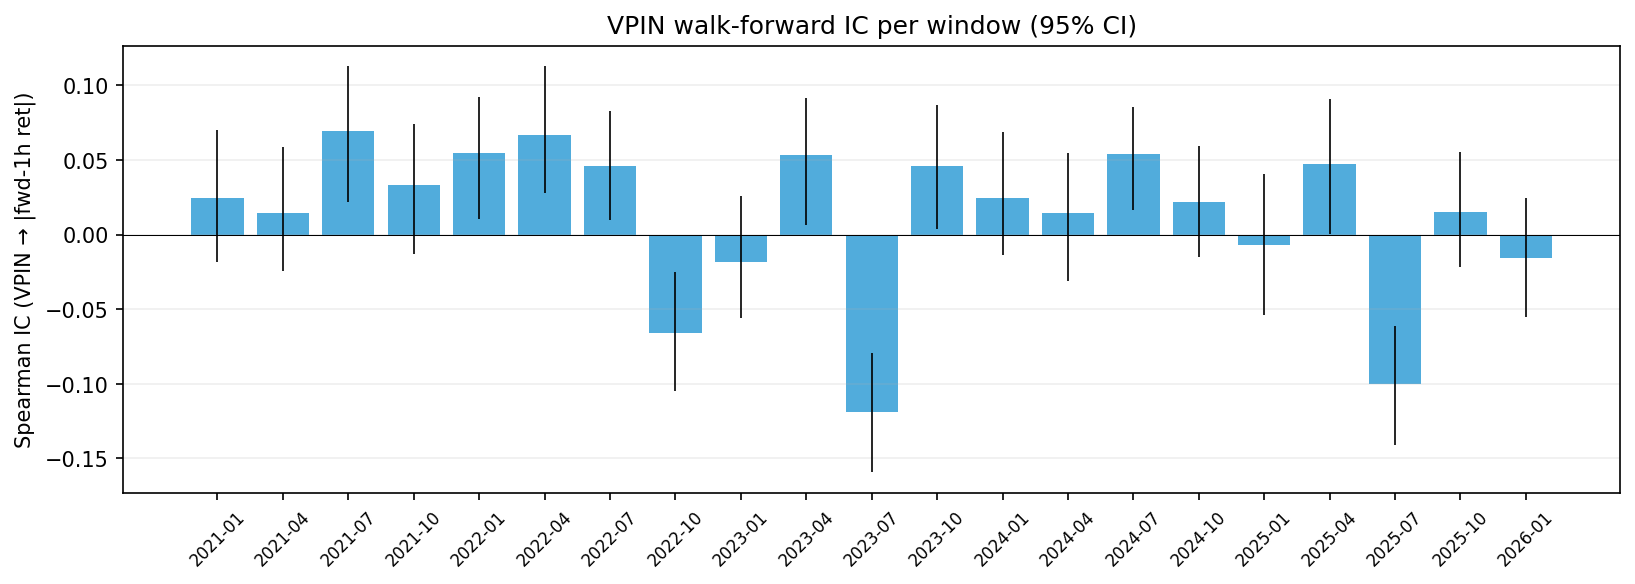
Per-window IC (21 windows)
| window | n | IC | ci_low | ci_high | p_value |
|---|---|---|---|---|---|
| 2021-01-02 → 2021-04-02 | 2160 | 0.0248 | -0.0182 | 0.0704 | 0.2497 |
| 2021-04-02 → 2021-07-02 | 2184 | 0.0144 | -0.0243 | 0.0586 | 0.5005 |
| 2021-07-02 → 2021-10-02 | 2208 | 0.0692 | 0.0219 | 0.113 | 0.0011 |
| 2021-10-02 → 2022-01-02 | 2208 | 0.0332 | -0.0128 | 0.074 | 0.1188 |
| 2022-01-02 → 2022-04-02 | 2160 | 0.0547 | 0.0105 | 0.092 | 0.011 |
| 2022-04-02 → 2022-07-02 | 2184 | 0.0666 | 0.028 | 0.1128 | 0.0018 |
| 2022-07-02 → 2022-10-02 | 2208 | 0.0459 | 0.0096 | 0.0828 | 0.0311 |
| 2022-10-02 → 2023-01-02 | 2208 | -0.0661 | -0.1048 | -0.0254 | 0.0019 |
| 2023-01-02 → 2023-04-02 | 2160 | -0.0186 | -0.0561 | 0.0261 | 0.3865 |
| 2023-04-02 → 2023-07-02 | 2184 | 0.0535 | 0.0065 | 0.0915 | 0.0124 |
| 2023-07-02 → 2023-10-02 | 2208 | -0.1187 | -0.1594 | -0.0791 | 0 |
| 2023-10-02 → 2024-01-02 | 2208 | 0.0458 | 0.0036 | 0.0866 | 0.0315 |
| 2024-01-02 → 2024-04-02 | 2184 | 0.0242 | -0.0139 | 0.0688 | 0.2585 |
| 2024-04-02 → 2024-07-02 | 2184 | 0.0144 | -0.0309 | 0.055 | 0.5008 |
| 2024-07-02 → 2024-10-02 | 2208 | 0.0543 | 0.0164 | 0.0853 | 0.0107 |
| 2024-10-02 → 2025-01-02 | 2208 | 0.0216 | -0.0151 | 0.0596 | 0.3098 |
| 2025-01-02 → 2025-04-02 | 2160 | -0.0069 | -0.054 | 0.0407 | 0.7493 |
| 2025-04-02 → 2025-07-02 | 2184 | 0.0475 | 0.0006 | 0.0911 | 0.0266 |
| 2025-07-02 → 2025-10-02 | 2208 | -0.1003 | -0.1409 | -0.0613 | 0 |
| 2025-10-02 → 2026-01-02 | 2208 | 0.0148 | -0.0215 | 0.0556 | 0.4857 |
| 2026-01-02 → 2026-04-02 | 2160 | -0.0156 | -0.055 | 0.0242 | 0.4673 |