Vol-targeting top megasweep strategies
PromotedVol-targeting top megasweep strategies
2026-05-17 · status: promoted · 7.5s
Hypothesis: Scaling position size by the inverse of the GBM vol forecast (target ann vol = 50%, capped 0.5×–2×) improves the risk-adjusted return (calmar, sharpe) of the three best megasweep strategies, without harming raw return.
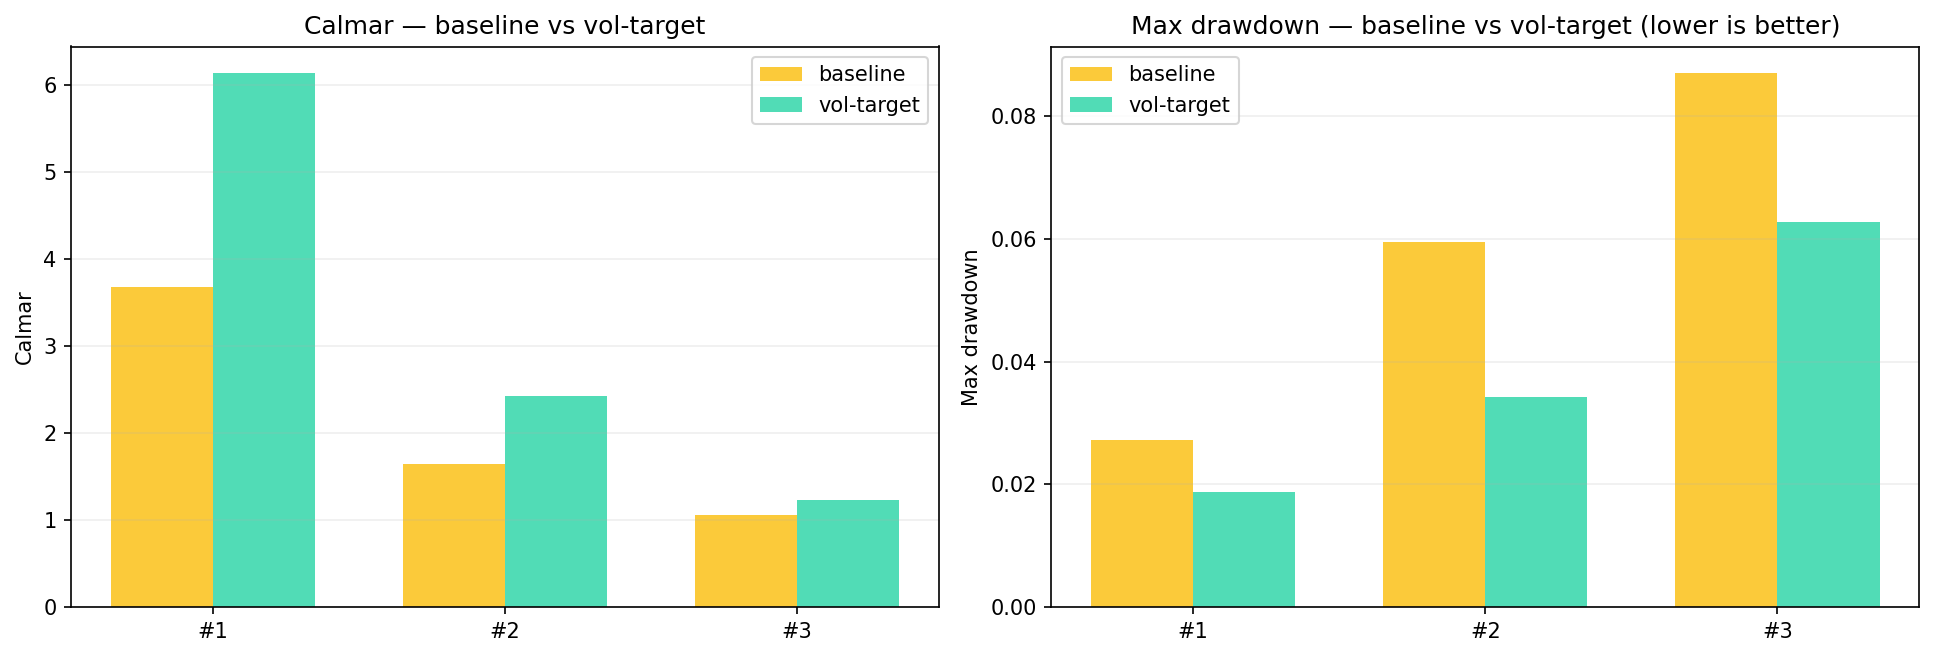
Verdict: SHIP — vol-targeting improves Calmar in 3/3 strategies (avg uplift +1.136). Drawdown change -0.0193, return change -2.36pp. Wire
vol_target_multiplierintoexecution/risk.pyfor live sizing — this is a clean overlay that doesn't touch strategy logic.
Key metrics
| metric | value |
|---|---|
| n_strategies | 3 |
| calmar_improved_count | 3 |
| avg_calmar_uplift | +1.1365 |
| avg_return_delta_pp | -2.3600 |
| avg_dd_delta | -0.0193 |
| target_ann_vol | +0.5000 |
| mult_cap | [+0.5000, +2.0000] |
Approach
We take the trades_list from the top-3 megasweep winners (sorted by score, distinct structures), then re-price each trade by applying a vol-target multiplier at entry time. Forecasts come from the same walk-forward GBM used in Vol forecast — no leakage: the forecast for trade at time t uses a model trained only on data before window t.
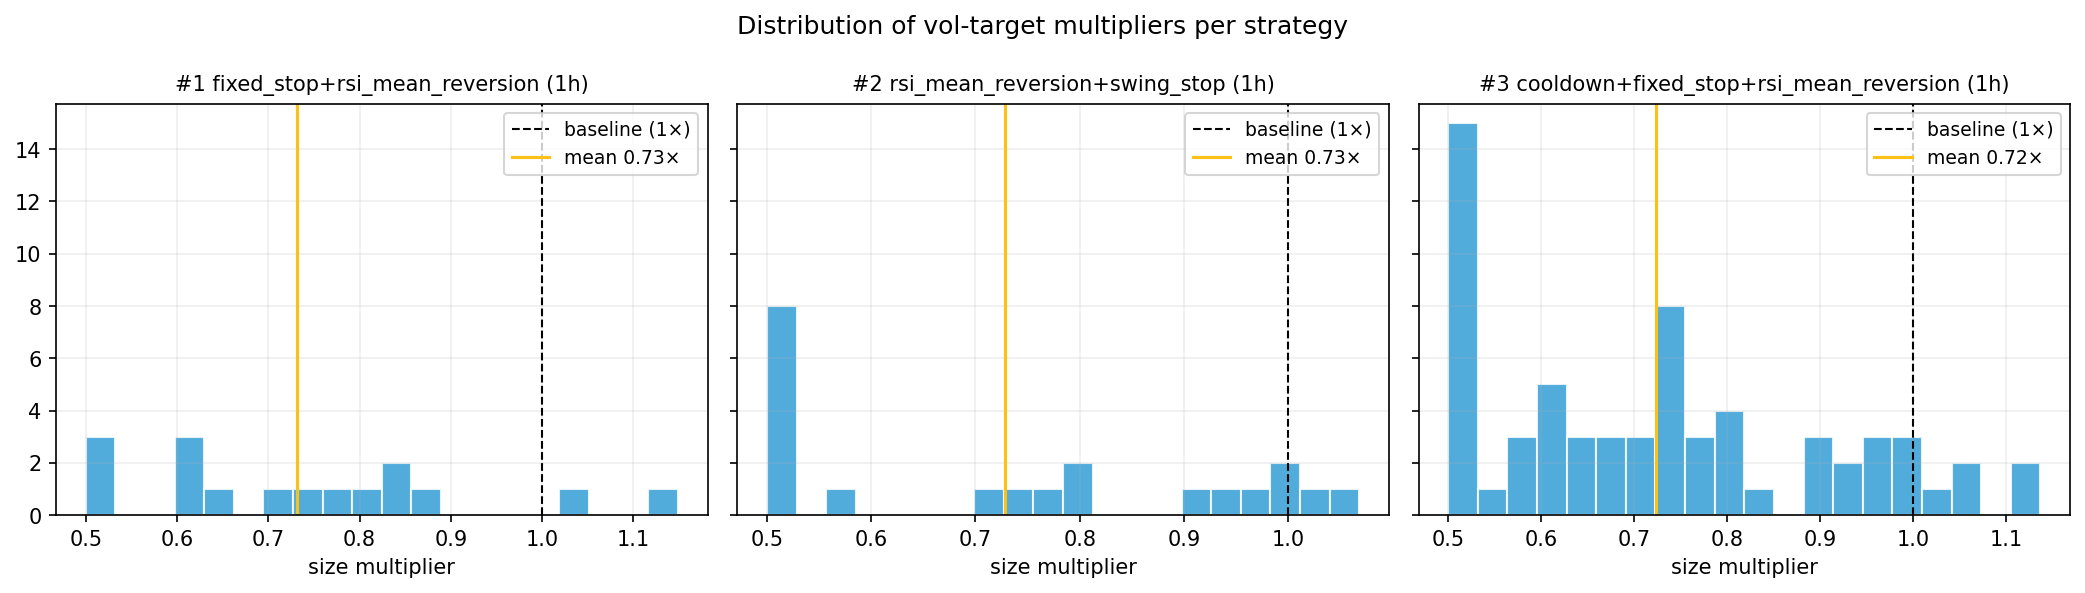
Sizing rule (ml.forecast.sizing.vol_target_multiplier):
- multiplier =
target_ann_vol / forecast_ann_vol - target = 50% annualised vol (≈ BTC long-run median)
- clipped to [0.5×, 2.0×] to avoid extreme positions
- forecast horizon = 240 min (4h — strongest GBM uplift)
Trade PnL, fees, funding all scale linearly with size. We don't change entry/exit timing — only how big each trade is. Calmar is the headline metric: if vol-targeting works, it should compress drawdowns more than it reduces returns.
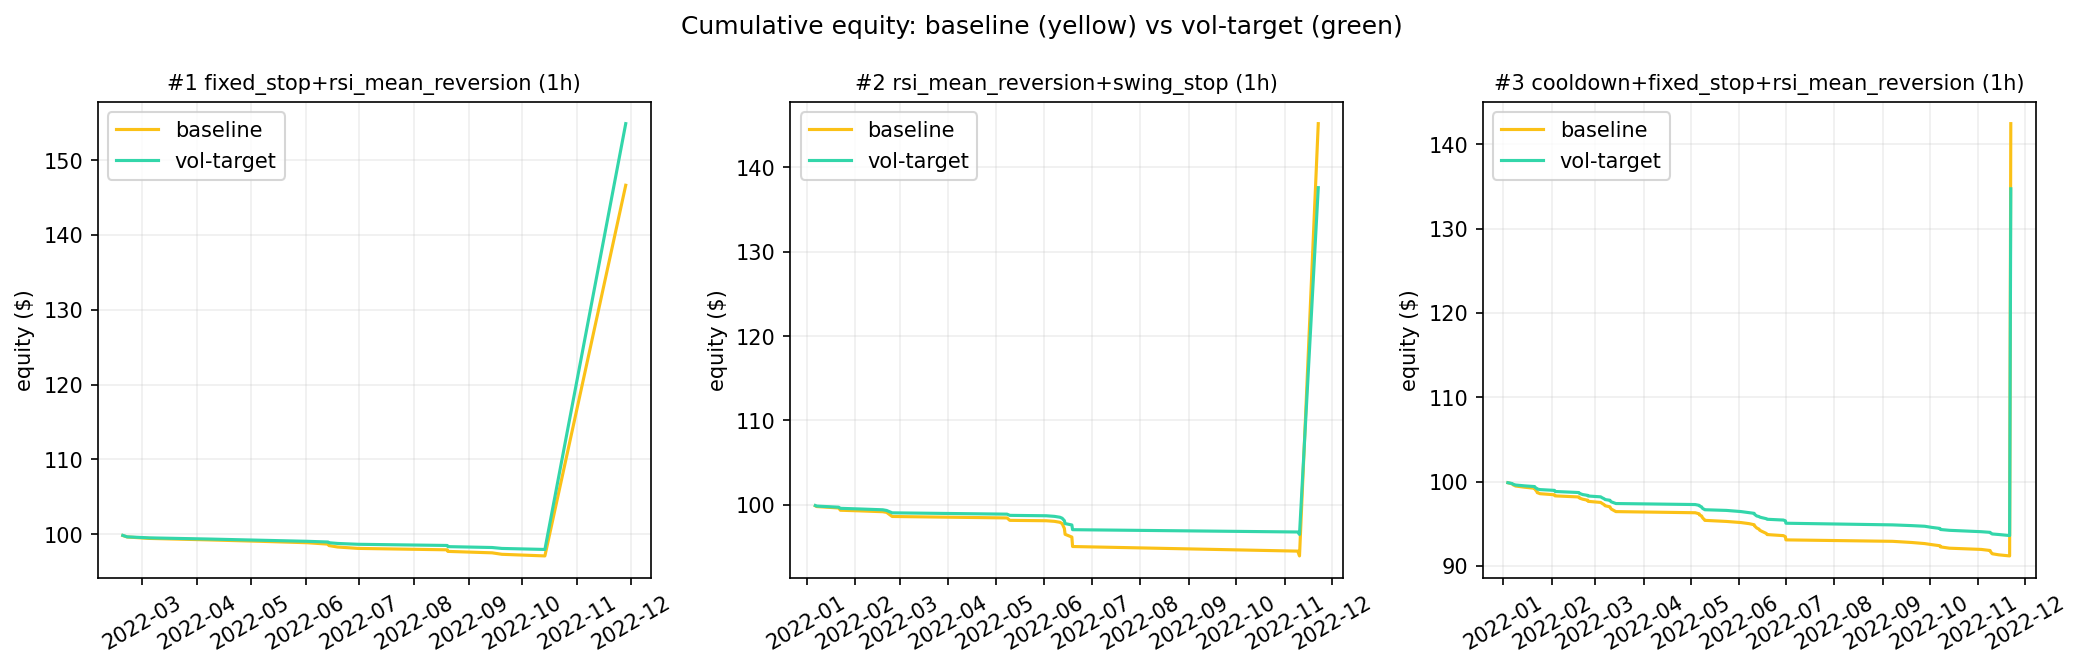
#1 fixed_stop+rsi_mean_reversion (1h)
- Params:
{'rsi_oversold': 20, 'rsi_overbought': 95, 'rsi_min_bars_in_extreme': 2, 'fixed_stop_pct': 1.5} - Trades: 16 (forecast available for 16, missing for 0)
- Vol-target multiplier: mean 0.73×, range [0.50×, 1.15×]
| metric | baseline | vol-target | delta |
|---|---|---|---|
| return % | 46.6417 | 54.8811 | +8.24 |
| annual return % | 10.0507 | 11.5661 | +1.52 |
| max drawdown | 0.0273 | 0.0188 | -0.0085 |
| calmar | 3.6812 | 6.1382 | +2.457 |
| sharpe | 0.4843 | 0.4968 | +0.012 |
| win rate | 0.0625 | 0.0625 | +0.000 |
| profit factor | 17.0022 | 27.7777 | +10.78 |
#2 rsi_mean_reversion+swing_stop (1h)
- Params:
{'rsi_oversold': 30, 'rsi_overbought': 95, 'rsi_min_bars_in_extreme': 3} - Trades: 21 (forecast available for 21, missing for 0)
- Vol-target multiplier: mean 0.73×, range [0.50×, 1.07×]
| metric | baseline | vol-target | delta |
|---|---|---|---|
| return % | 45.1976 | 37.6066 | -7.59 |
| annual return % | 9.7786 | 8.3137 | -1.46 |
| max drawdown | 0.0595 | 0.0342 | -0.0252 |
| calmar | 1.6442 | 2.4276 | +0.783 |
| sharpe | 0.4491 | 0.4667 | +0.018 |
| win rate | 0.0476 | 0.0476 | +0.000 |
| profit factor | 8.4512 | 11.7056 | +3.25 |
#3 cooldown+fixed_stop+rsi_mean_reversion (1h)
- Params:
{'rsi_oversold': 30, 'rsi_overbought': 95, 'rsi_min_bars_in_extreme': 1, 'cooldown_candles': 3, 'fixed_stop_pct': 1.0} - Trades: 65 (forecast available for 65, missing for 0)
- Vol-target multiplier: mean 0.72×, range [0.50×, 1.14×]
| metric | baseline | vol-target | delta |
|---|---|---|---|
| return % | 42.4511 | 34.7228 | -7.73 |
| annual return % | 9.2554 | 7.7414 | -1.51 |
| max drawdown | 0.0869 | 0.0627 | -0.0242 |
| calmar | 1.0649 | 1.2340 | +0.169 |
| sharpe | 0.4163 | 0.4246 | +0.008 |
| win rate | 0.0154 | 0.0154 | +0.000 |
| profit factor | 5.8173 | 6.4283 | +0.61 |
Summary table
| rank | structure | interval | trades | avg_mult | base_return_pct | vt_return_pct | base_max_dd | vt_max_dd | base_calmar | vt_calmar | base_sharpe | vt_sharpe |
|---|---|---|---|---|---|---|---|---|---|---|---|---|
| 1 | fixed_stop+rsi_mean_reversion | 1h | 16 | 0.731 | 46.642 | 54.881 | 0.027 | 0.019 | 3.681 | 6.138 | 0.484 | 0.497 |
| 2 | rsi_mean_reversion+swing_stop | 1h | 21 | 0.729 | 45.198 | 37.607 | 0.059 | 0.034 | 1.644 | 2.428 | 0.449 | 0.467 |
| 3 | cooldown+fixed_stop+rsi_mean_reversion | 1h | 65 | 0.724 | 42.451 | 34.723 | 0.087 | 0.063 | 1.065 | 1.234 | 0.416 | 0.425 |